


{{item.videoDuration}}
{{item.title}}
{{item.text}}

{{item.videoDuration}}
{{item.text}}
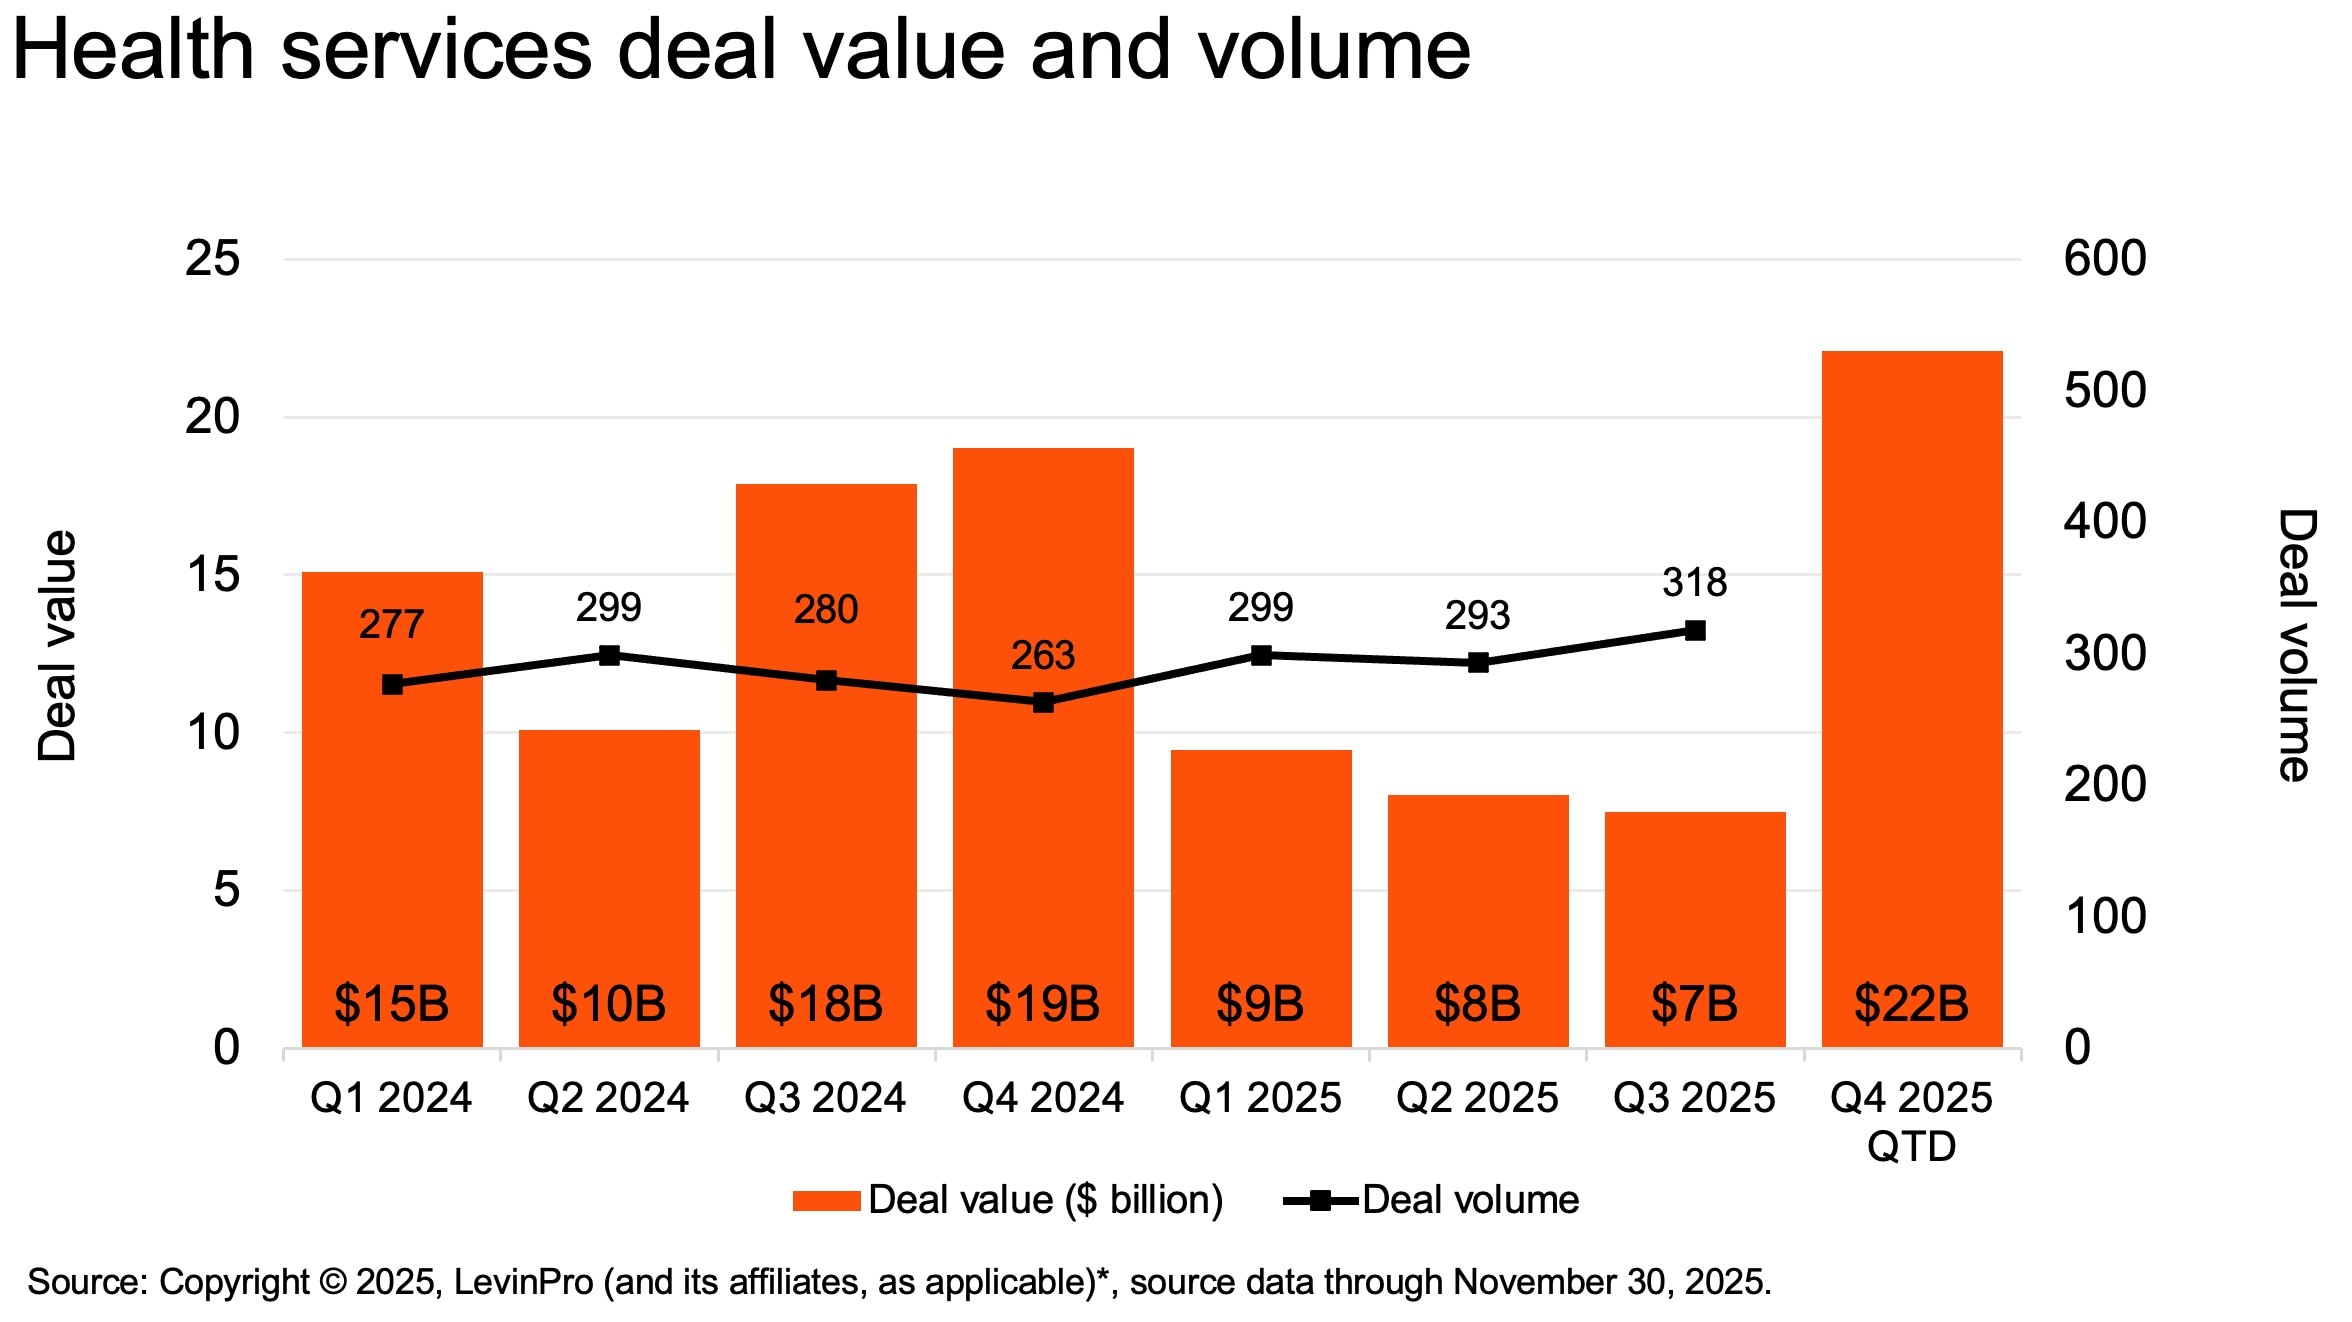
Health services deal value and volume will grow in 2026 as marketed assets improve in quality and leverage technology to attract both strategic and financial buyers while benefiting from more favorable market conditions. Despite a slight cooling in overall deal activity in 2025, the health services M&A landscape will regain strength in both value and volume of deals in 2026. While an uncertain US regulatory and reimbursement environment remains the primary headwind, investors will benefit in 2026 from assets coming to market in high-quality, cash-generating subsectors with clear reimbursement visibility. Both strategic acquirers and private equity sponsors will continue to favor acquiring smaller companies (bolt-ons) and selling portions of the business (carve-outs) that demonstrate consistent earnings and measurable operational upside, while avoiding areas prone to shifting regulations and reimbursement. Trends that emerged mid-2025 that we expect to continue through 2026 include:
“In health services, first movers who pair policy foresight with AI-driven execution will set the pace for the sector’s deals in 2026.”
Daniel Farrell,PwC, Health Services Deals LeaderThe coming year will likely mark an inflection point for health services M&A. The market is poised for a return to velocity. Investors will increasingly treat AI as a core driver of margin expansion and top-line growth — not a bolt-on enhancement — shifting valuation premiums toward platforms with proven operations leveraging real data. Tech-enabled care, behavioral health, and physician specialty platforms could see some of the most aggressive capital flows in years as acquirers look to scale models that can grow without adding labor. A meaningfully improved exit environment — with the return of mid-market IPOs and new market entrants — would widen deal pathways. And with mega-funds returning to offense, competition for high-quality assets is likely to intensify. The winners in 2026 will likely be the investors who move fastest: deploying capital with precision, embedding AI into every stage of value creation, and reshaping portfolios before policy and pricing shifts force their hand.
{{item.text}}
{{item.text}}


