







{{item.videoDuration}}
{{item.title}}
{{item.text}}

{{item.videoDuration}}
{{item.text}}
The One Big Beautiful Bill Act (OBBBA) enacted in 2025 set in motion approximately $1 trillion in healthcare funding reductions. In addition, more than 100 executive orders reshaped the government’s role in healthcare, upending the expectations that had been driving healthcare dealmaking for the last several years.1
Instead of making the strategic pivots necessary to find areas of growth less vulnerable to those funding cuts, or to acquire the capabilities necessary to thrive despite them, deals leaders across US health services cooled considerably in 2025 and 2026. A total of 290 M&A transactions in Q1 26 represents a 5% decrease compared to the prior year. Simultaneously, M&A involving physician organizations increased by 46%, driven by platform roll-ups and practice consolidation. The pattern is unmistakable. A handful of well-capitalized players are making transformative moves while much of the broader market has become increasingly cautious.
The policy retrenchment under OBBBA, combined with structural cost-revenue misalignment and consumer financial stress, is creating the same category of dislocation that rewarded decisive action in financial services.
This is what makes the current moment different from prior cycles. It is not cyclical; it is structural on both sides of the margin equation simultaneously, compounded by a once-in-a-generation federal policy retrenchment.
Why are so many healthcare leaders, hospital systems, payers, and private-equity-backed platforms waiting to act? Healthcare leaders are taking a wait-and-see approach, perhaps waiting for procedural clarity from OBBBA’s implementation across the states, or hoping state governments will find a way to replace the federal funding, or maybe hoping the results of the 2026 midterm elections will bring federal policy back to historical norms.
Many believe that making a strategic pivot now in the midst of uncertainty can be too risky, believing they have budgeted enough financial runway to sustain them.
News about the financial prospects of the sector is often driven by the reported results of the largest, publicly traded health services organizations. But many health services organizations in this country are smaller than those behemoths, and are privately held. In our work with both public and private leaders at healthcare organizations across the country, we have visibility into revenue forecasts and procedure volume assumptions underpinning organizational budgets, and actual results on a quarterly basis. We see the trajectory increasing the gap between what organizations planned for and what is materializing.
The midsize and smaller healthcare organizations that find themselves caught in that gap will likely find themselves facing the same decisions later, but from a weaker financial position with fewer options.
For example, many providers entered planning cycles with assumptions about reimbursement stability, volume growth, labor normalization, and margin recovery that are proving difficult to achieve in practice. Yet, hospital expenses grew 7.5% in 2025, more than double the 3.3% growth in hospital prices over the same period. Driving the growth: Labor costs reached $1.009 trillion (+5.6%), drug expenses surged 13.6% (21.6% at academic medical centers), supply costs rose 9.9%, and hospital bad debt climbed 10% in 2025.2 As actual performance diverges from original forecasts, organizations are reassessing not only earnings expectations, but also the underlying assumptions supporting strategic plans, valuation outlooks, and capital allocation decisions.
One in four finance leaders reported that margins fell short of goals. Cost reduction now ranks last among CFO priorities, not because it is unimportant, but because the traditional cost lever is approaching exhaustion. Finance leaders are often being forced to look beyond the conventional playbook as traditional cost reduction levers deliver diminishing returns relative to the scale of margin pressure and revenue often outside management's control. Whether through capability-driven scale, strategic collaborations, portfolio repositioning, or capital-light growth models, the imperative is the same: act now, or watch margins erode further.3
Revenue is coming in below budget assumptions, driven by payer-mix deterioration, coverage churn, and consumer deferrals.
Expense growth is outpacing price growth by a factor of two or more.
More than 56% of hospital costs are now tied to service lines where reimbursements fall below the cost of care.4
The gap is widening, not narrowing, as the year progresses.
This combination of simultaneous structural cost pressures on the supply side and demand erosion on the consumer side is compressing margins from both directions.
When healthcare organizations established their 2026 budgets, the impacts of recent structural changes had not yet materialized and were hard to quantify. Other external shocks were hard to foresee and plan for. As we head toward 2027, three forces are converging and compounding each other like a supercell:
An expanding set of financial implications is emerging as OBBA’s implementation begins in earnest in 2027. For example, the Medicaid redetermination in 2023–2024 resulted in more than 25 million disenrollments nationwide, with an estimated 40% to 50% of those losing coverage for procedural rather than eligibility reasons.5 The Congressional Budget Office projects an additional 7 million to 8 million individuals will lose Medicaid coverage over the next decade due to OBBBA’s Medicaid work requirements and accelerated redetermination cycles.6 KFF estimates that states with the most aggressive implementation timelines could see enrollment declines of 15% to 20% within the first three years.7 Expired ACA premiums have resulted in an estimated 3 million to 4 million individuals at risk of becoming uninsured or underinsured over the next 18 months.8
$43 billion in uncompensated care: Uncompensated care at US hospitals climbed from $38.3 billion in 2019 to $42.8 billion in 2022.9 As coverage losses accelerate, the AHA projects uncompensated care could exceed $50 billion annually within the next two to three years. Safety-net hospitals and systems serving large Medicaid populations are projected to absorb a disproportionate share.10
Reimbursement compression is deepening, not stabilizing: More cuts are now under discussion in the upcoming reconciliation bill. Federal spending reductions are impacting provider reimbursement, further compressing already-negative margins on safety-net populations. In 2024, hospitals received just 83 cents on the dollar from Medicare, resulting in more than $100 billion in aggregate underpayments,11 while aggregate hospital Medicare margins fell to approximately –11.6%.12 Without structural reform, this gap is projected to widen as Medicare payment updates continue to trail input cost inflation.
State-level fragmentation threatens to increase operating costs. States are diverging sharply in how they implement federal policy. As of early 2026, at least 15 had introduced or enacted Medicaid work requirements while others have pursued waiver extensions or legal challenges.13 This patchwork makes enterprise-level capital allocation and strategic planning significantly more complex for multi-state systems that must model reimbursement, volume, and payer mix assumptions market by market, and the divergent requirements will require more expensive changes to operations.
Our mid-term election analysis shows that providers face “growing financial strain and workforce disruption alongside targeted rural investment opportunities,” while payers should adapt to “coverage churn, PBM reform, and heightened program integrity scrutiny.”14
What PwC's Global M&A Outlook calls the “M&A triple threat” (tariffs, drug pricing pressures, and regulatory shifts) was an early signal of a broader reality—the entire cost structure of American health systems is being reshaped by forces that extend well beyond any single policy lever.15
Tariffs are only one layer. Supply chain fragility remains structural. Single-source concentration in important categories like contrast media and sterile supplies, for instance, continues to create unpredictable cost spikes that procurement teams cannot hedge against through contracting alone. Pharmaceutical input pricing is decoupling from negotiation leverage, independent of formulary management, as specialty drug costs, biosimilar adoption lag, and API pricing tied to global commodity markets drive pharmacy spend upward. Energy costs—an often-overlooked line item representing 3% to 5% of total operating expense for large systems—are climbing 10% to 15% annually as grid instability and rising power demand take hold, and all that is before the effects of the war in the Middle East show up in supply chain costs as healthcare organizations restock their 2026 inventories.16
Unlike labor inflation, which many organizations have been managing for two-plus years through workforce redesign and automation, these pressures are largely exogenous, concurrent, and difficult to offset operationally. The result is a cost structure that is not just elevated but structurally more volatile precisely when margins are under attack.
Of the multiple forces compressing healthcare margins, consumer financial stress deserves particular attention because it operates on the demand side of the equation, the side that most healthcare organizations rely on being relatively inelastic. We believe that over the next 6–12 months , consumer financial distress will likely become a material driver of volume loss and by extension revenue shortfalls beyond what many healthcare organizations are financially prepared for now.
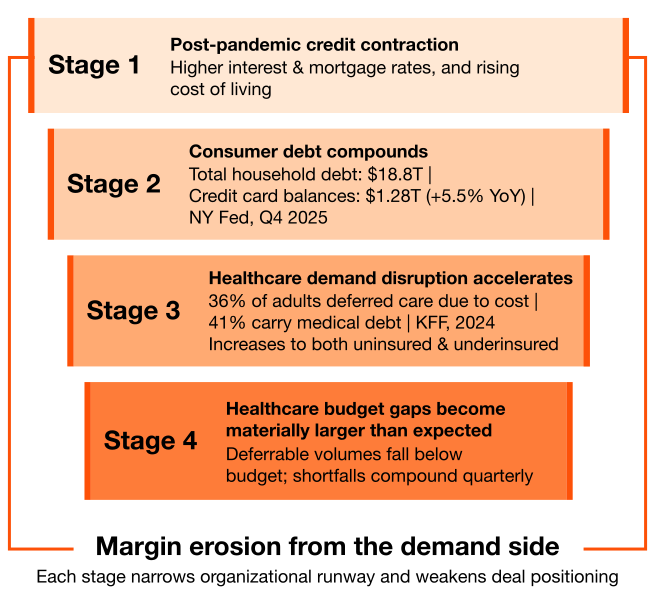
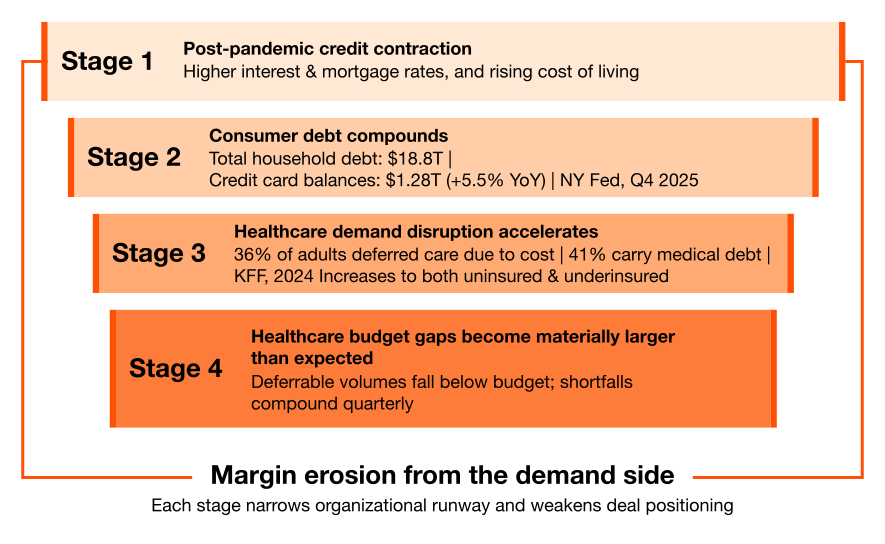
Healthcare demand is often treated as inelastic, but roughly 30% to 40% of hospital revenue is tied to deferrable procedures including elective orthopedics, non-urgent cardiac interventions, outpatient diagnostics, cosmetic and dental services.
During the 2023–2024 redetermination cycle, Kaufman Hall data showed outpatient visit volumes softened by 2% to 4% in markets with the highest disenrollment rates.17 As OBBBA Medicaid work requirements take effect next year and more people lose coverage, elective and scheduled volumes face the greatest risk—particularly in states that have opted against Medicaid expansion or have adopted more restrictive implementation pathways. As more families succumb to escalating financial stress, these service lines will be the first to see volume declines. For many community hospitals and ambulatory platforms, deferrable volumes represent the highest-margin work.18
National Health Interview Survey data show that 46% of uninsured adults did not see a physician in the prior 12 months, compared with just 13% of adults covered by Medicaid, a 33% gap in baseline healthcare engagement.19 Applying this differential to the population expected to lose Medicaid coverage suggests that for every cohort of newly uninsured individuals, approximately one in three will disengage from routine and elective care entirely.
All these forces are not operating in isolation. The American Hospital Association reports hospital bad debt climbed 10% in 2025.20 When patients with high-deductible plans or coverage gaps present for care they cannot defer—emergency services, acute episodes, maternity—the resulting accounts receivable are increasingly uncollectible. This is revenue that appears on the top line but never converts to cash. For organizations already operating at 1% to 4% margins, rising bad debt is the difference between solvency and restructuring.
Hospitals spent $43 billion in 2025 trying to collect payments insurers owe for care already delivered, including $18 billion overturning claims denials alone.21 Medicare Advantage plans denied approximately 17% of initial claims, with 57% of those denials ultimately overturned after costly appeals.22 The share of MA prior authorizations requiring appeals has risen from 7.5% in 2019 to 11.5% in 2024.23 This is not a new pressure, but it is intensifying at exactly the wrong time, when margins are already at their thinnest.
These are all examples of how consumer financial pressures and policy disruptions are compounding to amplify their collective effect on health services financial runways. We believe this is just one layer of an escalating healthcare demand destruction crisis.
The pressures we’ve described here are landing on organizations that were already contending with structural supply-side cost pressures, including post-pandemic labor cost resets mandated by workforce costs of $1 trillion+ annually, reimbursement rate compression, and tightening capital markets. The result is a two-front margin war that the traditional playbook of cost reduction programs, selective bolt-on M&A, and operational efficiency initiatives was not designed to address.
Asset valuation impact. For healthcare dealmakers, mounting consumer financial stress has a direct bearing on transaction values. Service-line volumes drive revenue projections, which drive EBITDA, which drives multiples. When deferrable volumes decline and payer mix deteriorates, trailing EBITDA compresses and with it, the valuation at which a seller can transact. Organizations that delay divestitures or partnerships while consumer headwinds intensify will likely find the value of their assets teetering on a deteriorating earnings base. This is why timing is the primary determinant of deal economics.
Industry surveys confirm this shift. Healthcare CFOs have moved cost reduction to last place among their margin improvement priorities, not because costs are controlled, but because the lever is approaching exhaustion.24 The new priorities are strategic growth, revenue diversification, financial restructuring, and capital redeployment. In other words, portfolio action. PwC's Global M&A Outlook reinforces this finding: “As business models evolve, divestitures will sit alongside acquisitions. And as AI matures, data-driven diligence, integration, and value creation will increasingly separate leaders from laggards.”25 By 2035, more than $1 trillion in global healthcare spending is projected to shift toward prevention, personalized care, home-based services, and digital ecosystems.26
The evidence is clear. The financial runway for healthcare organizations is shorter than most leaders assume and the forces compressing it are accelerating. The question is no longer whether to act but how and in what sequence. Our next articles in this series will provide a concrete framework for action through the near-term financial playbook and portfolio reset strategy.
{{item.text}}
{{item.text}}


