


Understanding the impacts of climate on our business

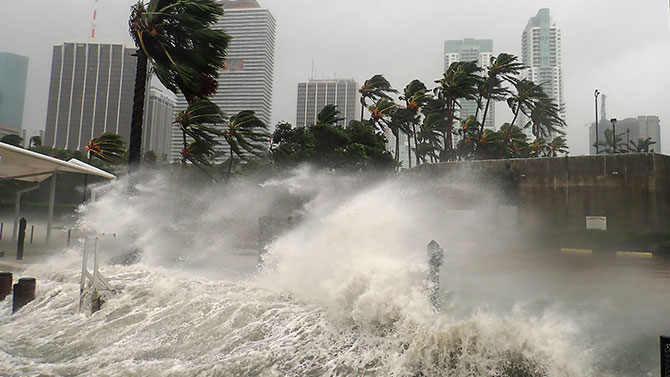
The frequency and intensity of extreme weather events are set to rise in the coming decades. And as temperatures and weather patterns shift, they'll spark social and economic changes worldwide. These environmental shifts will lead to shifts in economic activities and changes in populations as communities adapt—creating financial risks in markets and economies.
As we navigate these changes, we understand that our business faces financial risks—disruptions to our own offices, in the communities where our team members reside, and in the broader business landscape—which in many cases will include our clients.
There is an urgent need for us to adapt and build resilience against devastating climate-related impacts. Noting that we also need to continue to decarbonise the global economy in parallel, as that is the only real solution.
At PwC, we have been transforming our own business in response to climate change for a number of years.

Physical climate risk for PwC
We've taken a close look at how climate affects our business and value chain. By examining our global network, we've pinpointed areas most vulnerable to extreme weather—like floods, wildfires, and droughts. With this insight, we've crafted strategies to adapt and strengthen our resilience.
Read more about our physical risk journey here and explore how we are adapting our business.


Contact us

Global Leader, Corporate Sustainability, PricewaterhouseCoopers International Limited


Gurpreet Kaur
Director, Global Corporate Sustainability, PricewaterhouseCoopers International Limited