


An analysis of global commitment to delivering green infrastructure reveals potential pathways for private financing, amid a familiar divide between rich and poor countries.
Closing the green infrastructure gap
The urgency of mobilising private finance to decarbonise infrastructure worldwide is well understood. After all, energy, industry and buildings are responsible for more than 70% of global greenhouse gasses (GHGs); and as we have written before, public funding alone will not be enough to pay for what is now estimated to be a US$93.2 trillion transition1 at the scale and speed that is needed to meet the Paris Agreement goals limiting global warming to 1.5°C by 2030. Less clear is how private financiers, asset owners and policy-makers can work together to move from the current position, in which private capital principally flows to developed nations—largely into assets that are already generating predictable revenues—to a future position in which money also flows to what is often perceived as riskier and less stable opportunities in under-financed emerging and frontier markets.
These trends are reinforced by proprietary PwC research that found that private capital continues to heavily favour mature markets, i.e., high-income nations buttressed by membership in climate-conscious international organisations such as the OECD and the European Union (EU). Our study of 61 countries and territories—representing 83% of the world’s population, 88% of global GDP and 83% of the world’s CO2 emissions—indexed whether certain countries are significantly more attractive for private finance seeking exposure to green infrastructure than others, looking specifically at big-ticket items such as renewable power, electrification of transport, waste management and support for the circular economy. 2
As a rule, countries that have a more stable macroeconomic profile and a healthy financial market tend to be more attractive to banks and institutional investors. Crowded markets, such as Australia, the UK, Canada, the US and Sweden, scored significantly higher in our survey than less developed countries across Asia, South America and Africa when we plotted financial and macroeconomic factors against green growth, regulation and broader commitments to decarbonisation, as seen in Figure 1.

Green investors target saturated markets
Figure 1: Green Infrastructure Finance Propensity Index
Green investors target saturated markets
- Developed country (high and upper-middle income)
- Developing country (low and lower-middle income)
- Trend line
Enabling environment for green investing
- 2.9
- 2.7
- 2.5
- 2.3
- 2.1
- 1.9
- 1.7
- 1.5
- 1.3
| Country | Enabling environment for green investing | Commitment towards green investments |
|---|---|---|
| Australia | 2.730 | 1.986 |
| UK | 2.569 | 2.102 |
| Sweden | 2.461 | 2.127 |
| Canada | 2.545 | 1.996 |
| US | 2.665 | 1.857 |
| Chile | 2.537 | 1.833 |
| Netherlands | 2.423 | 1.945 |
| South Korea | 2.413 | 1.925 |
| France | 2.367 | 1.948 |
| China | 2.393 | 1.889 |
| Germany | 2.347 | 1.865 |
| Spain | 2.238 | 1.970 |
| Vietnam | 2.477 | 1.710 |
| Belgium | 2.217 | 1.948 |
| India | 2.383 | 1.743 |
| Portugal | 2.130 | 1.977 |
| Czech Republic | 2.170 | 1.849 |
| Philippines | 2.480 | 1.533 |
| Japan | 2.082 | 1.892 |
| Malaysia | 2.250 | 1.713 |
| South Africa | 1.980 | 1.981 |
| Indonesia | 2.170 | 1.758 |
| Poland | 2.121 | 1.779 |
| Italy | 2.051 | 1.844 |
| Colombia | 2.123 | 1.705 |
| Thailand | 2.185 | 1.635 |
| Saudi Arabia | 2.236 | 1.574 |
| Mexico | 1.965 | 1.834 |
| Pakistan | 2.187 | 1.545 |
| Greece | 1.909 | 1.820 |
| Kazakhstan | 2.009 | 1.709 |
| Brazil | 2.063 | 1.654 |
| Kenya | 1.911 | 1.773 |
| Turkey | 1.960 | 1.718 |
| Peru | 2.081 | 1.521 |
| Jordan | 1.886 | 1.714 |
| Morocco | 1.922 | 1.648 |
| Uzbekistan | 1.795 | 1.705 |
| Romania | 2.005 | 1.457 |
| Bangladesh | 2.047 | 1.414 |
| Argentina | 1.722 | 1.732 |
| Nigeria | 1.777 | 1.671 |
| Cote d'Ivoire | 1.900 | 1.513 |
| Guatemala | 1.690 | 1.665 |
| Ethiopia | 1.717 | 1.617 |
| Egypt | 1.865 | 1.420 |
| Mozambique | 1.652 | 1.625 |
| Ghana | 1.739 | 1.534 |
| Senegal | 1.621 | 1.640 |
| Ukraine | 1.573 | 1.685 |
| Benin | 1.593 | 1.659 |
| Azerbaijan | 1.717 | 1.494 |
| Dominican Republic | 1.736 | 1.469 |
| Iraq | 1.584 | 1.602 |
| Sri Lanka | 1.622 | 1.555 |
| Cameroon | 1.613 | 1.551 |
| Bolivia | 1.701 | 1.447 |
| Zambia | 1.443 | 1.659 |
| Congo, DRC | 1.610 | 1.470 |
| Ecuador | 1.561 | 1.502 |
| Angola | 1.419 | 1.554 |
Commitment to green investments
There is a certain practicality at work. Environmental, social and governance (ESG) commitments adopted by lenders, investors and policy-makers in these economies are driving positive results, including advancing the search for low-carbon technologies and assets, such as carbon capture and storage, hydrogen use, and renewable energy projects. What’s more, over the last decade, a record level of dry powder from infrastructure funds has been matched by a steadily increasing need for investment in new and retrofitted infrastructure. However, a large majority of the infrastructure money has yet to be invested in new builds and technology, as investors in these funds tend to be savings institutions looking for lower-risk, lower-return exposure. According to the OECD, US$120 trillion of spare capital is held by private equity funds, banks and other private investors.3 At the same time, the United Nations estimates that 75% of the infrastructure needed by 2050 has yet to be built,4 the vast majority of which is in emerging markets.
Investors are increasingly looking beyond purely financial data—the environmental and social impact of investing is now actively considered. The environmental and social returns of emerging market investment are inevitably higher than developed markets, but with risk.
The hard and unavoidable truth is that climate change does not respect borders: in the race to net zero, everyone wins, or everyone loses. A weather event, such as a heatwave, or sea level rise adds risk to even the “safest” infrastructure development if GHG abatement isn’t dealt with holistically. Greening only the OECD countries won’t stop nature-based events from damaging infrastructure in those countries. This underlines the importance of collaboration across industries, value chains and—crucially—borders to create viable market opportunities and share risk across larger jurisdictions. As we have written elsewhere, lenders and investors must broaden their strategies to take advantage of green opportunities in developing markets, such as the cohort of African nations in our survey that demonstrated higher-than-average scores on green growth, in addition to their current opportunity pipelines weighted to projects in developed nations. If capital is not distributed on an equitable global basis, the physical risk to the infrastructure in every corner of the world—whether developed or developing—will persist.
Access our data: PwC’s Green Infrastructure Finance Propensity Index tool offers a chance to engage and understand the investment landscape in greater detail.

Identifying new financing perspectives
The clear lack of a match between investment and lending strategies and opportunities in emerging markets to build badly needed infrastructure assets is the result of a potent and enduring perception that financial exposure to a developed market is “safe,” and the same exposure outside those specific regions is not. However, a deeper dive into our study data shows that it is not always the case that the best-performing nations offer the only viable opportunities. And by isolating individual criteria from our study—such as “green growth” or “commitment to green objectives”—we begin to uncover surprising insights. Although it is important to stress that one should not assume a causal relationship, for example, between a single criterion and a risk-adjusted return on investment, opening up new perspectives on opportunities for global green infrastructure financing will be critical to the larger project of reorientating the energy and capital of financiers, policy-makers and stakeholders to where it is needed most.
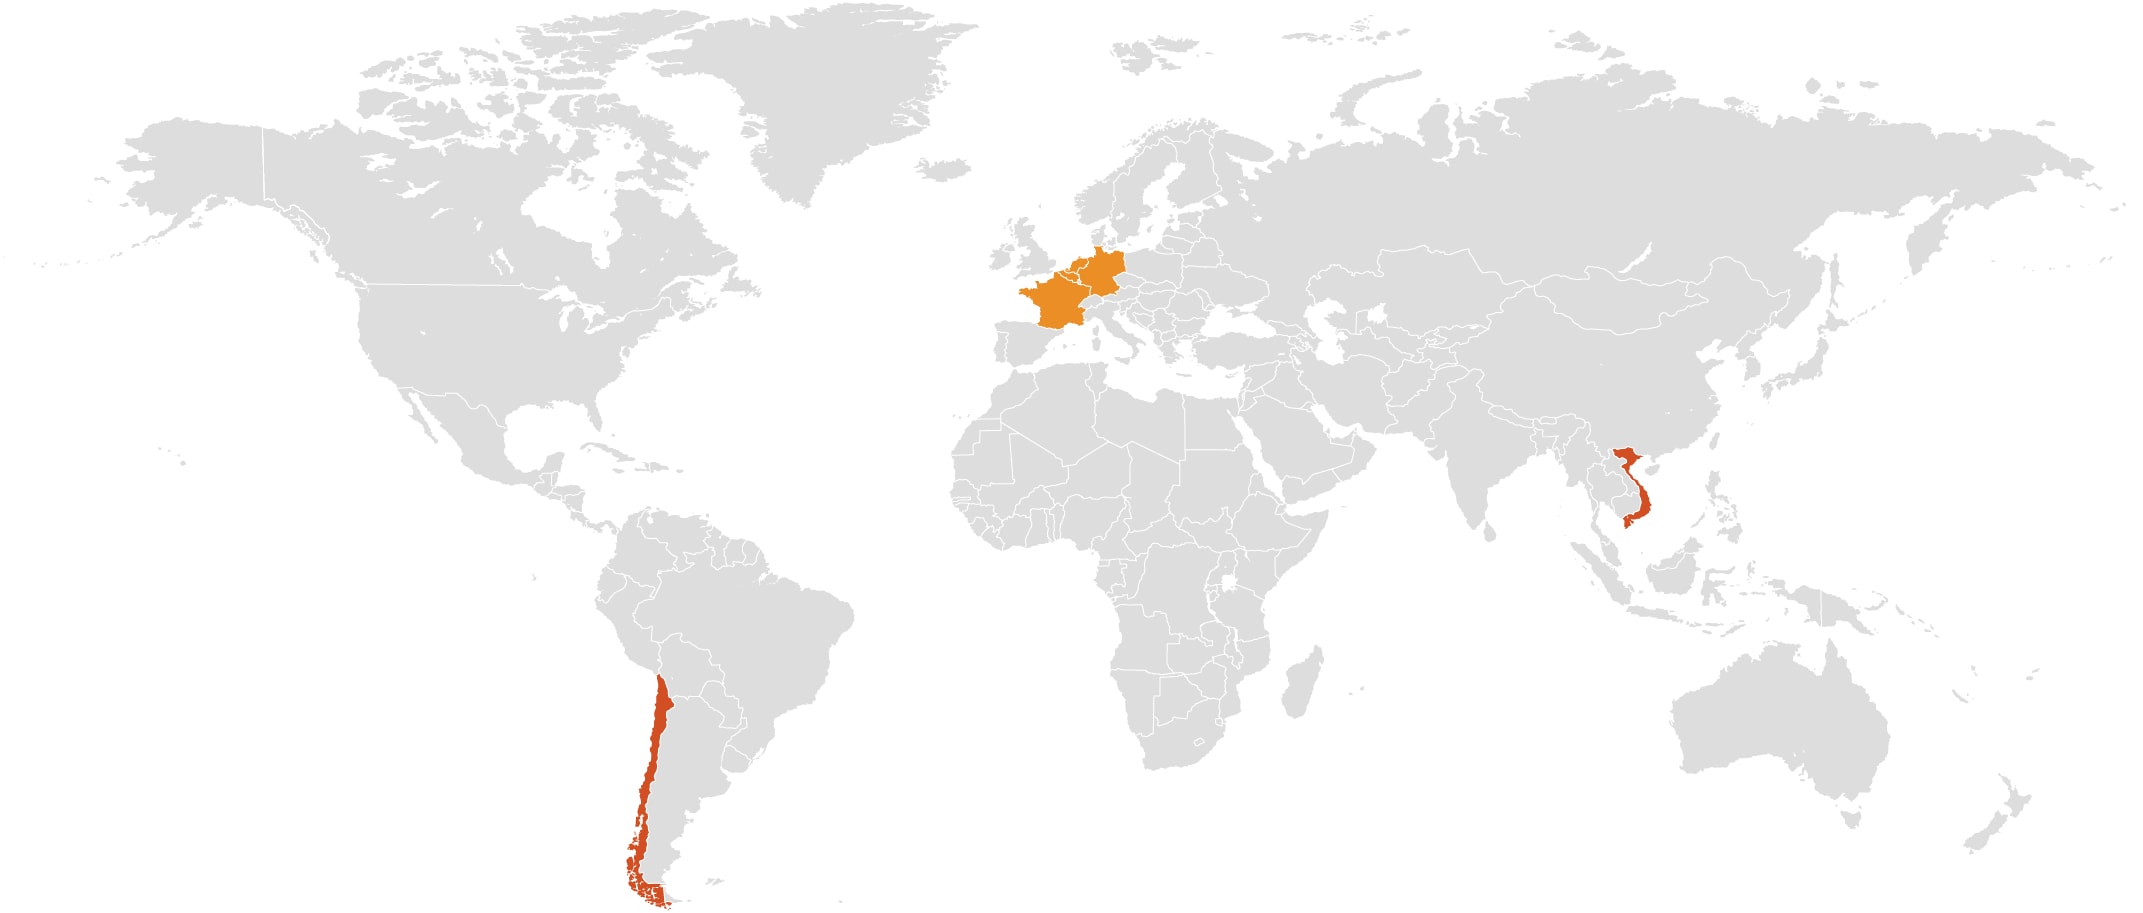
Take, for example, the specific criterion of “green financing opportunities,” in which we indexed the pipeline for green infrastructure, the issuance of green bonds and the availability of green official development assistance (ODA). Western European countries (which are all in the best-performing category) have similar scores for green financing opportunities. Their scores range from –8% to +6% compared with the average of all other countries included in the study, as they are diluted by relatively large GDPs and demonstrate an important degree of market saturation for green infrastructure.
By contrast, an analysis of Vietnam, which is not among the highest-performing countries or territories in the overall index, shows a +32% score for green financing opportunities. This demonstrates the key finding that the value of projects in this jurisdiction exceeds its relatively modest GDP, and far outperforms its position against global heavyweights, where low risk typically yields low return for investors. Indeed, in Vietnam we’ve witnessed the creation of a dynamic market for both local and overseas investors in primary and secondary markets; and government reforms have opened up opportunities in large-scale solar and wind projects (both in hilly areas and offshore), resulting in an increase in green financing opportunities.
Another example, Chile, a country with economic characteristics similar to those of Vietnam, is catapulted to the top of the index by its green financing score of +41%—the highest score in our study for this criterion. Political stability, a clear and consistent regulatory framework—including a national policy to reach 100% renewable energy by 2050—and openness to international investors combine to create an attractive environment in which to promote and invest in clean energy projects. Currently, wind and solar make up the bulk of power generation projects under construction—and the capital city of Santiago already has the second-largest electric public bus transportation fleet of any country in the world (although it is surpassed by some cities in China).
Figure 2: Green financing opportunities outside the usual suspects

Key factors: Financial stability and commitment to green growth
What do these findings tell us? First, countries where the will to decarbonise is arguably strongest are not adequately registering with lenders and investors. What’s more, current trends in private capital deployment require deeper and more thoughtful analysis to begin to identify new pathways to match financing with vital infrastructure projects.
Delving further into the data, we undertook an exploration by grouping our six key criteria—macroeconomic environment, green financing opportunities, strength of the financial market, green growth, regulatory and business environment, and commitment to green objectives—into two major dimensions: ‘Enabling environment for green finance’ and ‘Commitment to green investments.’
Dimension 1: Enabling environment for green finance
When we looked at the dimension ‘Enabling environment for green finance,’ we analysed whether a country’s macroeconomic fundamentals and the opportunities provided by its financial market can enable new financial commitments to sustainable infrastructure assets. The factors are macroeconomic environment, strength of the financial market and green financing opportunities. Each country’s financial market and ecosystem was assessed against its resilience/maturity, the availability of green capital and the presence of sustainable infrastructure opportunities.
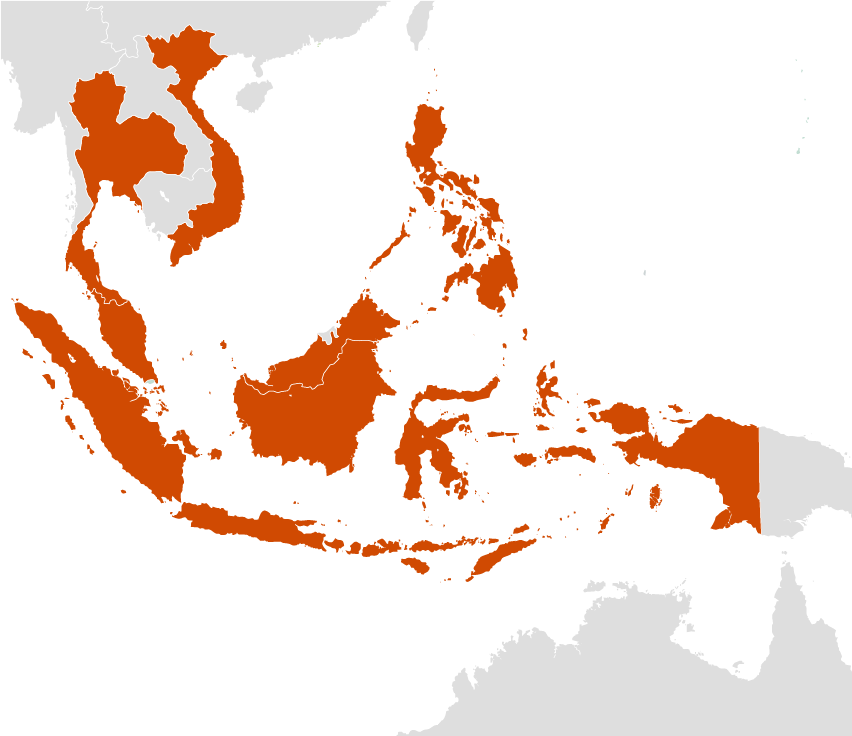
Southeast Asia, for example, has an overall index score 7% above the sample average, as compared with the average of 17% of the top-indexed countries in our survey (as seen above in Figure 1). However, compared with the rest of the data set, the region stands out for its combination of strong financial and macroeconomic stability and a low commitment to green financing. This seems to be a preferable scenario for private capital looking to create the most value from capital deployment in developing markets in which there is a strong green infrastructure project pipeline and a reliable financial and regulatory framework. It also suggests that these types of countries may be able to mitigate the risks associated with lending and/or investing in greenfield infrastructure projects.
Figure 3: Strong financial and macroeconomic stability helps mitigate risks
- 1
- 2
- 3
- 4
- 5
- 1. Vietnam
- 2. Malaysia
- 3. Thailand
- 4. Philippines
- 5. Indonesia
Southeast Asia
Dimension 2: Commitment to green investments
When we assessed ‘Commitment to green investments,’ we looked at the overall commitment of a country’s government towards the realisation of green infrastructure projects or assets. Here, we analysed elements of policy-making, such as the presence of tax incentives for the deployment of green technology or the official commitments made at COP26 through the country’s nationally determined contributions (NDCs). We also considered whether the country has macroeconomic fundamentals that could serve as proxies for future green infrastructure demand, such as population growth, a low ratio of renewables in its total energy mix and elevated levels of CO2 emissions per unit of GDP.
Our Figure 4 example shows the opposite side of the coin: an ambitious commitment to green investments in Southern Europe, partly driven by EU membership, yet without a strong enabling environment for financing of green infrastructure. The region has an overall propensity index score 7% above the sample average, while its regulatory and business environment is a significant 46% above average, demonstrating strong policy and regulatory support for renewables such as wind and solar, alongside a massive project of retrofitting energy grids. This result pushes the region’s overall ‘commitment to green investments’ score to 11% above average, just 2 percentage points below the best-performing countries and territories in our index.
Although infrastructure represents a niche opportunity for many unaccustomed to it, these findings signal an opportunity for investors with a longer-term investment horizon to gain access to sectors that would otherwise be inaccessible outside traditional ecosystems and regulatory environments.
Furthermore, although greenfield infrastructure projects are generally regarded as higher risk, pushing lenders and investors to require higher returns, sectors such as solar and offshore wind illustrate how technologies once perceived as risky become mainstream worldwide within ten to 15 years. This evolution has been achieved through a combination of technical innovation and underpinning of early business models with subsidy support. Lenders and investors have become comfortable with the range of technologies and business models used internationally. And with the increased scale of deployment has come a decrease in the overall cost of technology. These combined factors have led to the sectors becoming more self-sufficient, which in turn has decreased the need for subsidy support. Although the business models for green hydrogen, carbon capture and storage, and small modular reactors are still in their infancy, we expect these sectors to de-risk over time in a manner similar to that of renewable energy.
Figure 4: A strong commitment to green investments plays to a long-term investment horizon
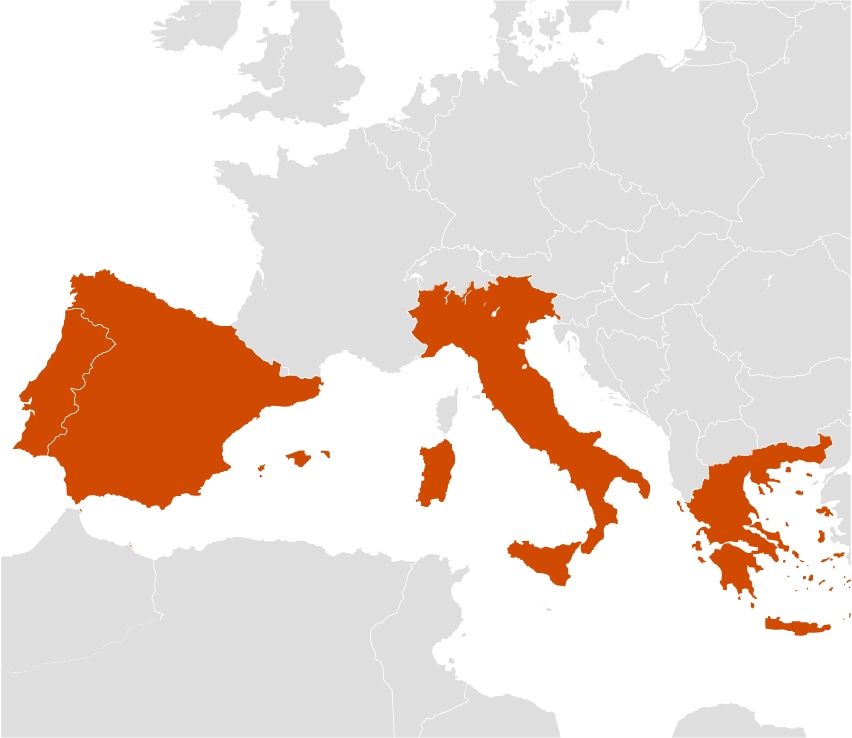
- 1. Portugal
- 2. Spain
- 3. Italy
- 4. Greece
Southern Europe

Green growth in emerging markets
The challenges of crowding in private finance into emerging and frontier markets are well documented, including the thorny issue of transition financing. However, we believe that there are clear opportunities to adopt low-carbon technology, despite the fact that many of these markets are reliant on carbon-intensive industries and many developed economies are also reliant on the products that these industries create. It’s also the case that emissions continue to rise in many emerging markets as a result of growing populations and strengthening economies.
However, a large cohort of emerging economies, including a significant percentage of African nations, have the highest green growth scores in our study. As expected, our research shows that five of our six criteria have the same directional trajectory—from highest- to lowest-performing—however, the opposite was true when isolating the green growth criterion specifically, where we looked at population growth (2020–50), CO2 per unit of GDP and percentage of renewable energy produced over total energy.
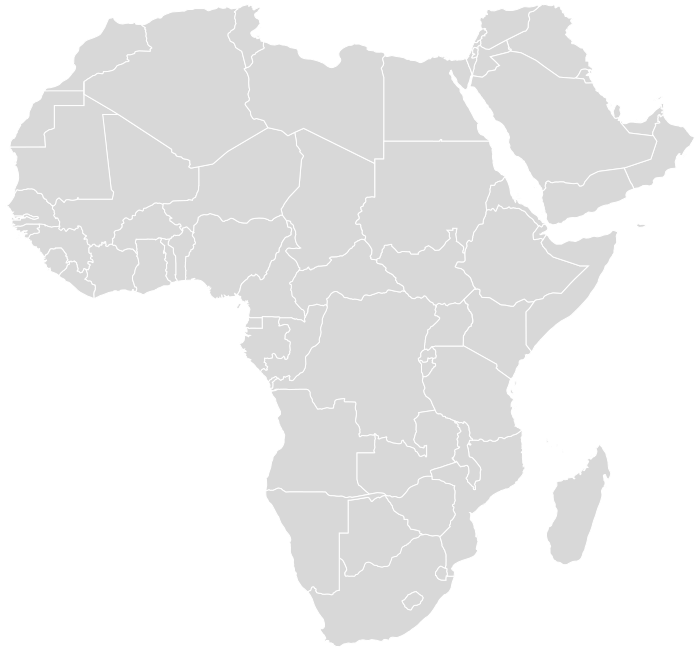
This green growth score represents a cohort of developing and emerging markets—16 countries and territories that account for less than 2% of global GDP. They are the highest scoring for green growth, at 5% above average, compared with a green growth score of 5% below the average for the best performers in our survey. Although countries with higher scores tend to have higher emissions per unit of GDP, which heavily damages their green growth score, this finding shows a clear opportunity in less-developed nations to align investment strategies with this momentum as they grow in their attractiveness for investment. For example, the African nations in our survey (see Figure 5) stand out for their above-average levels of green growth, at +11%. At the same time, these nations’ overall scores put them at the bottom of the table with an average of –11%, mainly as a result of their very low levels of emissions as compared with developed countries.
These scores further underpin financing opportunities in greenfield projects, an area of growing interest for those who are no longer willing or able to compete in developed markets owing to the cost of capital or saturation in renewable energy. Although emerging market infrastructure projects generally are perceived to be riskier, their overall environmental return may be higher, provided there is a plan in place to mitigate construction and technology risks. Improving green financing ecosystems to enable investment in zero-emissions companies and technologies is also critical, especially in terms of available capital and policy incentives that favour full commercial financing of new technologies.
Figure 5: Mapping green growth against overall score
- -28
- -24
- -20
- -16
- -12
- -8
- -4
- 0
- 4
- 8
- 12
- 16
- 20
- 24
- 28
| Country | Overall score | Green Growth score |
|---|---|---|
| South Africa | 6 | 28 |
| Kenya | -1 | 16 |
| Morocco | -4 | -1 |
| Nigeria | -8 | 16 |
| Côte d’Ivoire | -9 | 5 |
| Ethiopia | -11 | 11 |
| Mozambique | -12 | 25 |
| Egypt | -12 | -7 |
| Ghana | -12 | 1 |
| Senegal | -13 | 9 |
| Benin | -13 | 19 |
| Cameroon | -15 | 9 |
| Zambia | -17 | 20 |
| Democratic Republic of the Congo | -18 | 10 |
| Angola | -20 | 7 |

Five priorities to attract private finance to global green infrastructure
Our propensity index reveals the extent to which significant gaps persist in the financing of global infrastructure. Clearly, greater global consensus is needed on a range of important factors: climate risk management and modelling; standards, frameworks, and incentives (including disclosure frameworks on emissions reduction); carbon pricing and taxation; and policy tools and timelines. But as lenders and investors give greater weight to the carbon and GHG profile of projects, requiring a balance between financial and environmental return requirements, opportunities arise to set up financial and regulatory systems that help lessen risks. Here we detail five priorities to help spur this activity. These priorities will not solve the problem themselves, but they will go a long way toward accelerating global decarbonisation.
Clear and comprehensive net-zero plans. Currently, many plans are aspirational and unfunded, making them marketing documents rather than deliverable plans. Robust, realistic plans will encourage private-sector investment and supply chain mobilisation.
Collaboration across sectors, value chains and countries. Shipping cannot decarbonise without on-land infrastructure, aviation cannot decarbonise without a supply of biofuels, and greener steel production is reliant on the use of low-carbon hydrogen. Regional cross-border solutions will also be key to achieving greater circularity (for example, the pending trade deal among Singapore, Japan and Australia for the import/export of solar power in return for hydrogen).
Financial market focus on carbon and GHGs when lending and investing. This is likely to be the single largest accelerant in developed markets to taking carbon out of society. Blended public-sector and private-sector finance—in which public finance takes the higher risks—is critical to achieving decarbonisation in emerging markets in which citizens are less able to pay the full cost of attaining net zero. Multilateral development banks and donor agencies are active promoters of blended finance, although the scale of investment is not sufficient to meet current targets. It is unlikely net zero can be achieved in emerging markets without a significant level of external grant financing from developed nations.
Heavy investment and taxpayer support in developed markets for emerging decarbonisation technologies. Leaders must recognise that emerging markets don’t have the same spending power and thus will likely benefit from de-risked technologies later, as in the case of solar panels. The idea of achieving net zero depends upon technologies that don’t exist today.
Paying for net zero. Carbon taxes in the production of goods or services are designed to reduce emissions and the demand for products with a high footprint by increasing prices, and thus incentivise less carbon-intensive production. At a cost to households and businesses, carbon pricing could raise substantial revenues that are critically needed to make decarbonisation affordable and pay for the greening of infrastructure.
Access our data: PwC’s Green Infrastructure Finance Propensity Index tool offers a chance to engage and understand the investment landscape in greater detail.
PwC has developed the Green Infrastructure Finance Propensity Index using the following criteria. Macroeconomic environment: S&P sovereign risk rating score, Gini coefficient and GDP growth (2016–26). Green financing opportunities: pipeline of green investment opportunities (2022 onwards), number of green bonds issued and green ODA availability. Strength of the financial market: Sharpe ratio (2016–21), non-performing loans to total gross loans, domestic credit to private sector as a percentage of GDP, country risk premium and equity market capitalisation as a percentage of GDP. Green growth: population growth (2020–50), CO2 per unit of GDP and renewable energy production as percentage of total energy production. Regulatory and business environment: OECD carbon pricing score, green incentives and ease of doing business index. Commitment to green objectives: companies that set science-based targets towards net zero and government nationally determined contributions (NDC) commitments. These indicators were collected from the following sources: S&P Group, World Bank, IMF World Economic Outlook, Investing.com, NYU Stern, Fitch Solutions, Climate Bonds Initiative, OECD, Wittgenstein Centre, SBTi, Climate Watch and proprietary PwC sources.
Footnotes
1 UNOPS: Infrastructure for Climate Action, https://content.unops.org/publications/Infrastructure-for-climate-action_EN.pdf.
2 PwC’s Green Infrastructure Finance Propensity Index defines green infrastructure as green energy production (e.g., solar, biofuels, hydrogen), electricity sector besides production (e.g., electric vehicles, electric highways), clean transport (public transport), waste treatment and circular economy.
3 Green bonds: Mobilising the debt capital markets for a low-carbon transition, OECD, https://www.oecd.org/environment/cc/Green%20bonds%20PP%20%5Bf3%5D%20%5Blr%5D.pdf.
4 Sustainable infrastructure and finance: How to contribute to a sustainable future, UN Environment Programme, https://wedocs.unep.org/handle/20.500.11822/7756.
5 The figure shows the region’s/country’s average score (across all six criteria) with respect to the global average score of the 61 countries and territories in the study (the latter is set to a baseline of 100). Such analysis measures the extent of a region’s/country’s deviation from the average score of the sample, both in terms of overall score and across all of the six criteria that compose it.
6 The figure shows the region’s/country’s average score (across all six criteria) with respect to the global average score of the 61 countries and territories in the study (the latter is set to a baseline of 100). Such analysis measures the extent of a region’s/country’s deviation from the average score of the sample, both in terms of overall score and across all of the six criteria that compose it.
Contact us