


Asia Pacific Net Zero Economy Index 2023
Moving beyond commitment and towards transformation: Asia Pacific climate actions not on track
Asia Pacific economies must achieve a challenging annual decarbonisation rate of 17.2% to limit global warming to 1.5°C by 2050.
by Lit Ping Low and Daisy Chee
At PwC, we recently released the 15th Net Zero Economy Index, our annual indicator of progress towards reducing energy-related CO2 emissions and decarbonising economies. In this article, we report on the current state and rate of decarbonisation in Asia Pacific, as well as the unique challenges and opportunities ahead.
Asia Pacific is the world’s fastest growing region, with an economic growth rate of 3.9%1 (ahead of the global rate of 3.5%)2. However, it is also at the epicentre of the climate crisis — both in terms of contributing to carbon emissions (representing almost half of global emissions) and, as with the rest of the world, in terms of physical impacts from climate change. Developing Asia Pacific economies are the growth engine for the region and are located in the areas most threatened by the impacts of climate change. In the absence of climate action, under the high emissions scenario, they could lose a staggering 24% of gross domestic product (GDP) due to the effects of climate change by 2100.3
Asia Pacific share of global CO2 emission and decarbonisation rate in 2022, in comparison with selected economic groups


While Asia Pacific continued to decarbonise in 2022, the rate of decarbonisation is nowhere near fast enough. The region reduced its carbon intensity in 2022 by 2.8% — more than doubling the 2021 rate of 1.2% — this rate falls short of the 17.2% required if we hope to limit global warming to 1.5°C above pre-industrial levels. This figure is stark. The Asia Pacific economies need to accelerate a policy and market-led transition, particularly as attention shifts from renewable energy and electric vehicles (EVs), to a broader range of mitigation actions addressing agriculture, the built environment and industry.
Navigating energy, investments and growth – challenges in decarbonising Asia Pacific
Several significant factors are contributing to Asia Pacific’s continued dependence on carbon-intensive energy sources, including:
The global energy crisis
Shortfall in renewable energy investments
Rapid growth of the region’s economies
The energy crisis has changed socio-political priorities, and in many economies, market liberalisation efforts have stalled while energy security has dominated the agenda. Energy supply disruptions, soaring energy prices and a spike in energy demand post-pandemic coupled with high summer temperatures in 2022 have caused unplanned outages and higher energy bills, putting pressure on the public and governments to turn back toward cheaper, dirtier forms of energy such as coal.5 6
Shortfall in renewable energy investments. Although Asia accounted for around 60% of the world’s newly installed capacity and 48% of global renewable energy capacity in 20227, its annual clean energy investments need to more than double from US$62.3 billion in 2022 to US$138.6 billion during the years 2026–2030 and US$165.8 billion during the years 2031–2035 to meet net zero pledges by 2050, according to the International Energy Agency (IEA). The IEA added that excluding China, the rest of Asia will need six to eight times more annual investment than the 2022 level by 2031–2035.8
Finally, the region's economies have more than doubled in size since 2000, and energy supply has increased at a compound average growth rate of 3.7% over the past two decades9. Developing Asia Pacific economies are expected to account for almost two-thirds of global energy demand growth by 2040, and these economies will increasingly rely on energy imports, especially oil and gas, to sustain economic growth10.
Costly to change — more costly to delay
Recent global events have undoubtedly created significant challenges for Asia Pacific governments, but the inescapable reality is that a continued slowing of decarbonisation will hasten the arrival of climate tipping points. Already this year, we’ve had a glimpse of what this may entail, while further analysis shows what else may be at stake.
In 2023, the region was hit by a number of well documented weather events; the ripple effect of which could create much larger problems. For example, the supply of rice — Asia’s staple food — is under threat by drought in India, and the hottest winter on record has Australians on tenterhooks over the likelihood of summer bushfires.
Moreover, Asia’s highly populated low-lying coastal zones make the region the most exposed globally to sea level rise, storm surges, floods, and land subsidence. About 70% of the global population affected by sea level rise will be in the region. More than 62% of transport infrastructure assets are highly exposed to inland flooding, and many of the region’s megacities are at risk from sea level rise and storm surges11.
Reality falling short of commitments
Decarbonisation rate and NDC (tCO2/GDP) in Asia Pacific economies, 2022

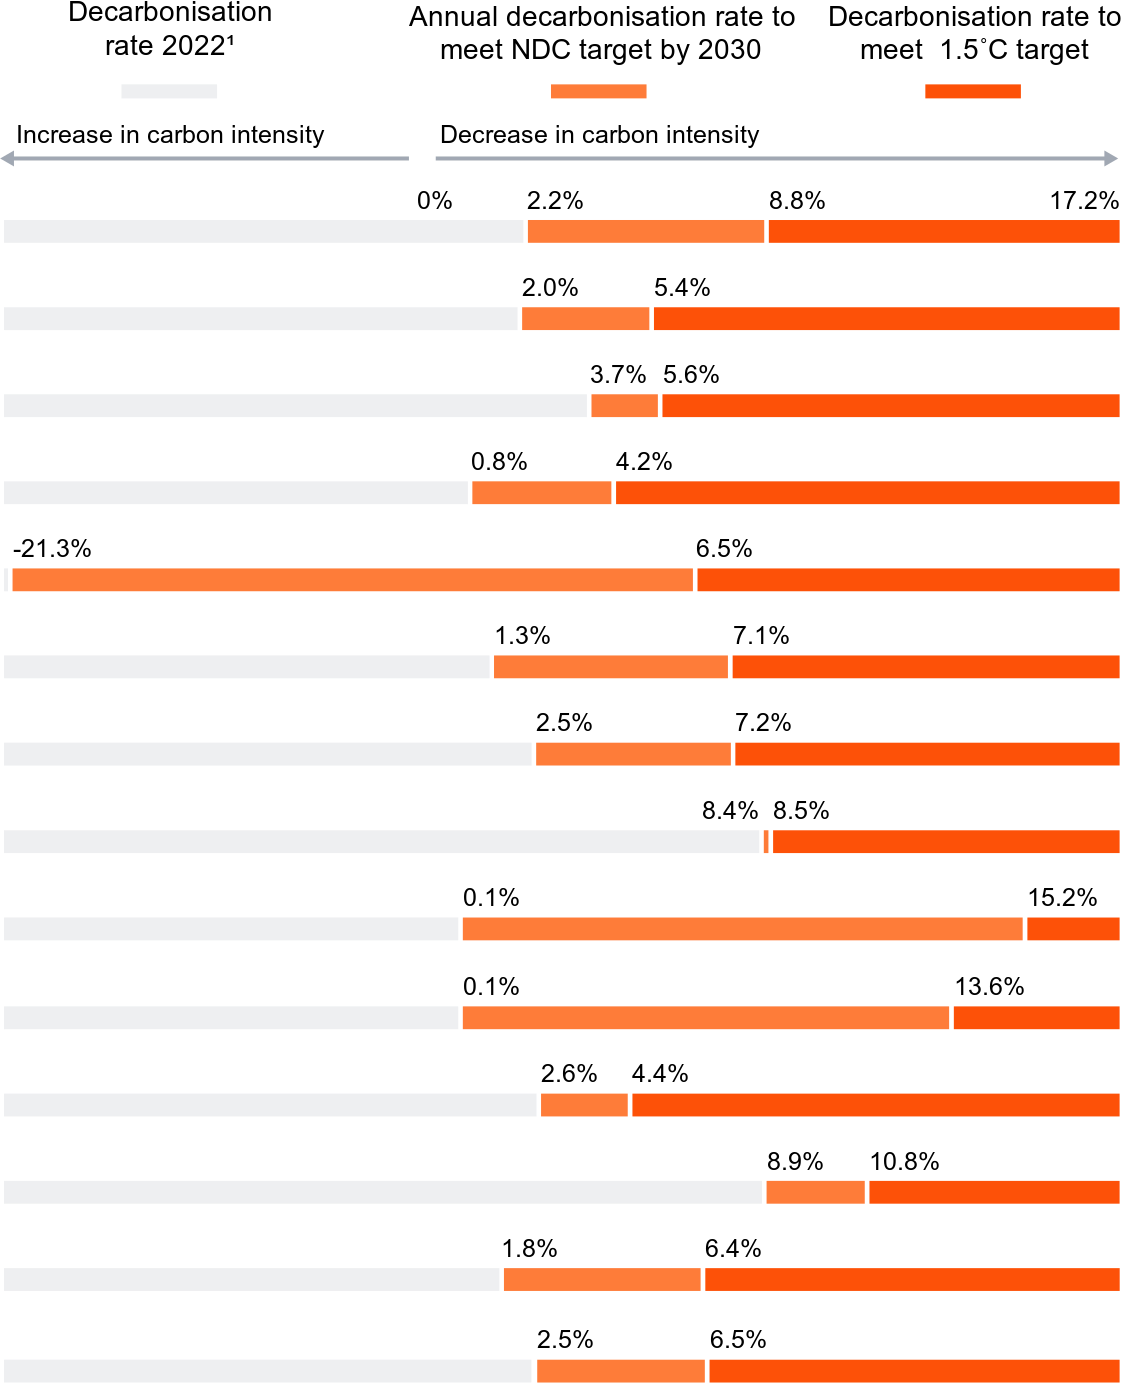
The figure above shows that none of the Asia Pacific economies' decarbonisation rate in 2022 came close to the rate required to align with a 1.5oC target, although five economies exceeded the decarbonisation rate needed to meet their respective nationally determined contributions (NDCs). The common factor between these economies is they are net importers of energy and most of them experienced a drop in their fuel factors (i.e. became less reliant on fossil fuels in their energy production).
The exception was Pakistan, because it faced a severe energy crisis amidst rising global energy prices in 2022, which led to a shortfall in energy production and fossil fuel imports.15 Although this had a positive impact on emissions, it had negative economic and social repercussions, with frequent power cuts leaving nearly 220 million people without electricity. This highlights the need to address energy security and a just energy transition as economies in Asia Pacific transition to net zero.16
Excluding Pakistan, the economies with the highest decarbonisation rates include Singapore (10.8%), followed by New Zealand (8.5%), Vietnam (6.5%) and South Korea (4.4%).
Despite these tentatively positive signs in some nations, other economies’ rate of decarbonisation has slowed in 2022 compared to 2021, with some experiencing an increase in carbon intensity.
There has been a notable increase in Indonesia’s carbon intensity, estimated to be in the range of 15%-21%.17 This is partly driven by the rebound of energy consumption, which fell significantly in 2020 and 2021 as a result of the COVID-19 pandemic, then rebounded to exceed pre-COVID levels in 2022 as the economy recovered. In particular, the country's coal consumption for energy rose with the expansion of in-country mineral processing, particularly nickel for the steel and battery sectors, together with the general rebound in industrial activity. Coal consumption in 2022 was 222 million tonnes, compared to 162 million tonnes in 2019.18
Other economies have lagged behind in their decarbonisation ambitions, with negligible change from 2021. Chief among them: the Philippines and India, with decarbonisation rates of 0.1% and 0.8%, respectively, where we've seen sustained reliance on fossil fuels in energy production.
Most economies face a notable gap between their NDC decarbonisation ambitions and performance in 2022. Even those economies that met or were close to meeting their NDC targets in 2022 fell short of the required 17.2% per annum reduction in carbon intensity.
After COP26 in 2021, countries were called upon to strengthen and resubmit their NDCs in 2022, due to the large gap between the emissions cuts required to limit warming to 1.5°C and the emissions reductions currently planned.19 Thus far, only six economies in Asia Pacific have done so, and only half of those have submitted more ambitious goals.20 Australia, Thailand and Singapore have strengthened their NDC targets, while Indonesia, Vietnam and India’s NDCs remain unchanged.
To make meaningful progress, while managing economic and energy-specific challenges, we need a holistic and integrated approach. One that offers a broader foundation, where the focus extends beyond renewable energy, EVs and energy transition. This is crucial, because while the energy and mobility sectors account for 49% of greenhouse gas (GHG) emissions, the remaining 51% come from food, agriculture and land use, as well as industry and the built environment.21
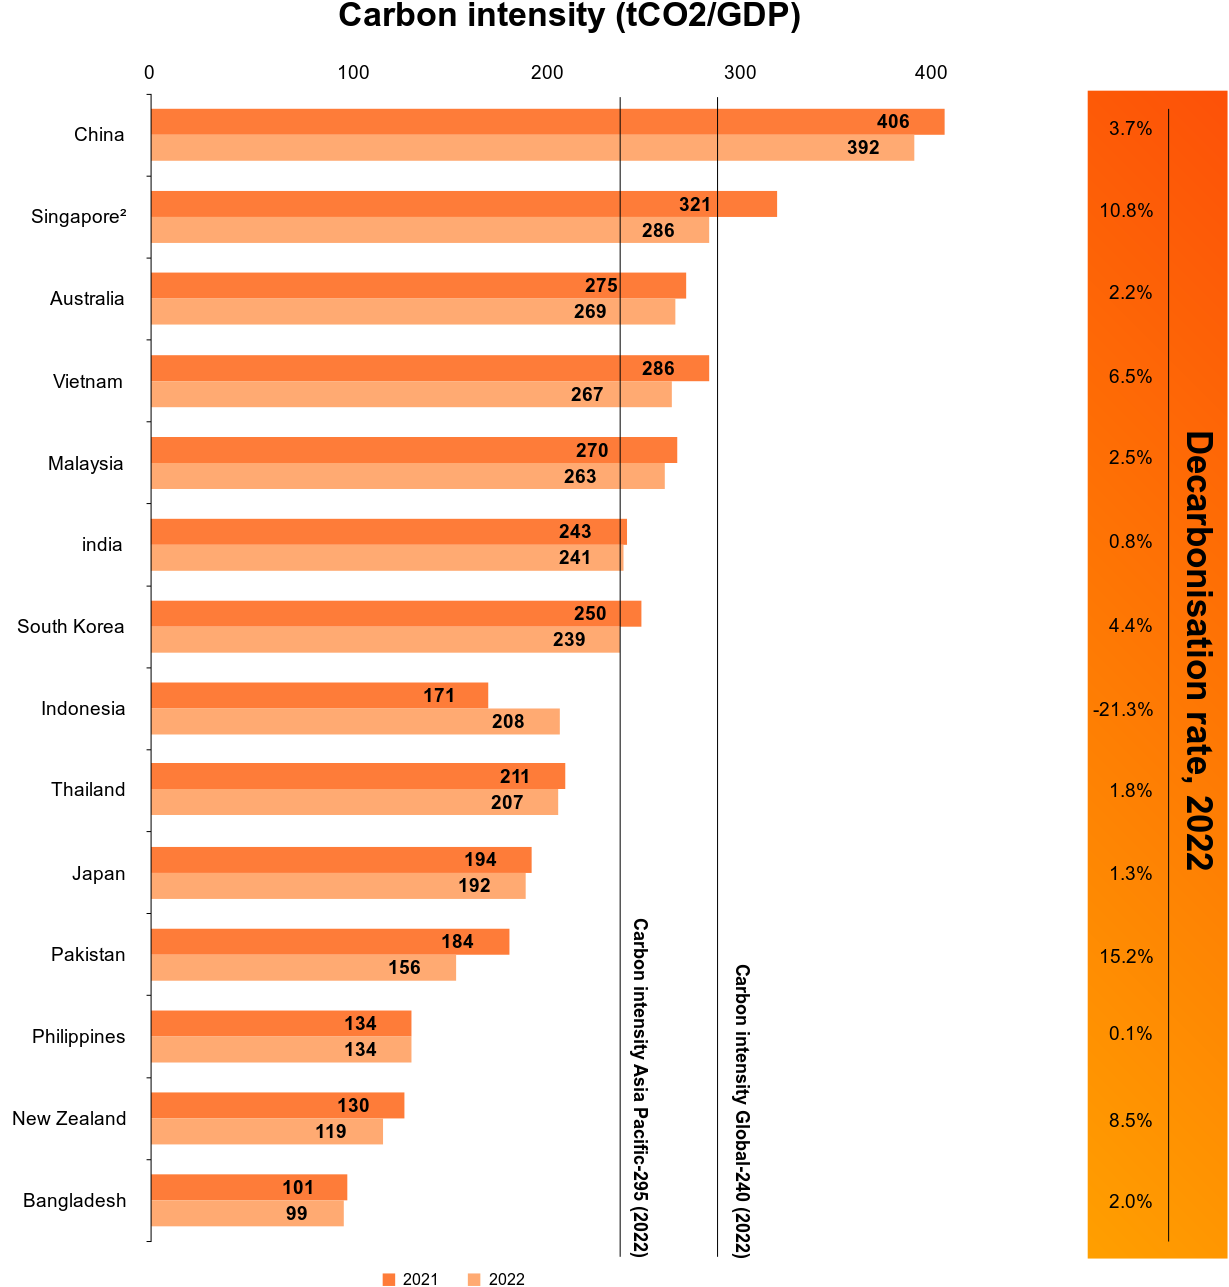
Carbon intensity in Asia Pacific
It's encouraging that the carbon intensity is going in the right direction (decreasing) but half of the Asia Pacific economies are near or above the global average. We also found no clear distinction between the carbon intensity of developed and developing economies. This could be due to local factors such as population, capital and energy demand. Economies like Australia, Vietnam and Malaysia have similar carbon intensity, as do India and South Korea. So, there’s no one-size-fits-all approach to decarbonisation.
Carbon Intensity1 (tCO2/GDP) (2021 and 2022) and decarbonisation rate (2022) in Asia Pacific economies
Energy intensity, fuel factor and carbon intensity of Asia Pacific economies for 2000, 2010, 2020 and 2022
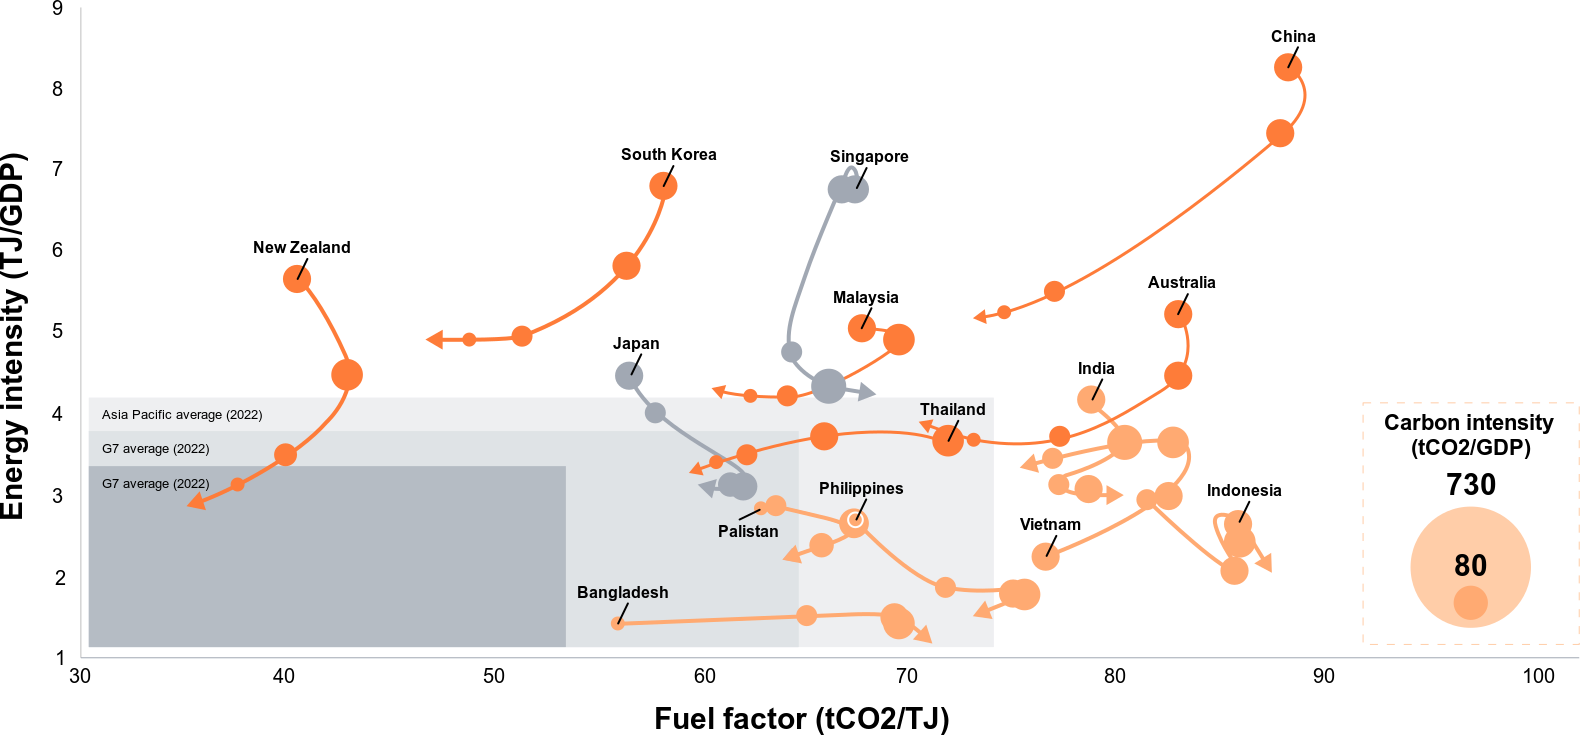
As Figure 4 shows, economies need to shift more towards the bottom-left quadrant of the plot as they reduce the share of fossil fuels in their energy mix (moving left) and reduce the energy intensity of their economies (moving down).
Over the past 20 years, only a minority of Asia Pacific economies managed to consistently reduce their carbon intensity. Economies making notable progress here include Australia, China, Malaysia, New Zealand, South Korea and Thailand.
Despite the challenges in decarbonisation, a silver lining is that most economies have managed to consistently reduce their energy intensity as seen in the downward shift in the trend lines.
The graph shows three distinct pathways that Asia Pacific economies are currently taking:
1. Yellow economies are progressing towards lower emissions.
They show encouraging progress in terms of both the direction of their efforts and the pace of progress. Most remain carbon intensive, but the momentum is promising as most show consistent sustainable related policies and rapid growth in renewable energy and EVs usage.
2. Grey economies are progressing towards lower emissions but continue to rely on fossil fuels for energy production.
Japan and Singapore are energy import dependent economies looking at new technologies such hydrogen and carbon capture and storage (CCS) to sustain their energy imports whilst reducing their emission footprint. In the short-term, they will continue to rely on fossil fuels until new technologies can be commercialised and scaled-up.
3. Red economies show negative or slow progress.
These are mostly developing economies with low GDP per capita and are highly reliant on fossil fuels to supply affordable energy. The upside is that the energy intensity of these economies is generally lower than the G7 average, meaning that a reduction in fuel factor (by embracing renewable energy and phasing out fossil fuels) could significantly reduce carbon intensity.
Turning climate ambition into reality
Looking ahead, the evidence is clear and concerning. We are on the brink of failing to limit global warming to 1.5°C above pre-industrial levels. The United Nations Environment Programme (UNEP) report in 2022 serves as a sobering reminder that the world’s current trajectory is perilous.22 According to the report, the policies presently in place point to a 2.8°C temperature rise by the close of this century, a scenario fraught with catastrophic consequences for ecosystems, societies and economies. Even if we muster the collective will to implement the current climate pledges, our best-case scenario narrows only slightly, projecting a 2.4°C to 2.6°C temperature rise by the century's end. The slow pace of global decarbonisation places humanity on thin ice. Holistic, collective action is required.
While recognising the complexities of forming (and delivering) collective plans, policies and regulations, we urgently need stronger government commitment and cross-border collaboration. And there’s plenty that business leaders can do to facilitate and accelerate Asia Pacific’s transition to net zero, too.
How business can be part of the solution
Move past target setting to execution
Corporations are behind on operationalising their ambition to achieve net zero. They need to take double materiality considerations into account and mobilise every business function towards achieving net zero transformation. From production, procurement and finance, to marketing, technology and HR, everyone needs to pivot how they operate, process and manage people and resources.
Prioritise progress over perfection
Decarbonising is a long game, made more complex and challenging by the unpredictability of markets. Sustainability and net zero are complex issues, with constantly evolving standards, regulations, frameworks, expectations, technology and science.
To thrive in this environment, businesses require a shift in mindset — away from expectations of certainty and towards one that embraces a consistent, incremental and fluid approach. This will give organisations the agility and resilience to adapt along the way towards the overall net zero goal.
See the potential for decarbonisation to create value
Many companies still view sustainability and decarbonisation through the short-term lens of regulatory compliance. But this underestimates the enormous long-term financial benefits that could be theirs. By integrating sustainability into a company's strategy, operating model and processes, there is huge potential to create value (see the section below "Pathways forward for businesses").
Support a just transition
A just transition is critical to ensure that vulnerable communities are not left behind on the way to a lower carbon future, and that the benefits and costs of climate action are distributed fairly.
Micro-small-to-medium-sized entities (MSMEs) are a prime example here. Such businesses account for 41% of Asia Pacific’s GDP and 69% of national labour force,23 and the Association of Southeast Asian Nations (ASEAN) estimates the economic contribution of MSMEs is even higher, accounting for 85% of employment.24 Small-to-medium size enterprises globally also collectively account for at least 50% of the business sector’s GHG emissions, according to OECD.25
As such, achieving the net zero transition in the Asia Pacific region is contingent upon the active participation of MSMEs. However, it is important to note that MSMEs will require substantial support to effectively make this transition. According to the International Federation of Accountants (IFAC), MSMEs, on an individual basis, lack the necessary innovation assets and resources to successfully transition towards net zero.26
This is an area where big companies can make a significant contribution. By collaborating with their supply chains, larger businesses can help MSMEs to make necessary adjustments to reduce Scope 3 emissions throughout the entire value chain.
Pathways forward for businesses
Corporate opportunities and value creation strategies for decarbonising:
- Assist other organisations to help lower Scope 3 emissions: There is increasing pressure from the public and investors for companies to make an impact in climate change. One of the main challenges is reducing Scope 3 emissions, which accounts for 65–95% of most companies’ carbon footprints.
- Switch to circular economy (CE): A CE is a model of production and consumption that aims to keep resources in circulation for as long as possible. Switching to a CE is estimated to have 30-50% value capture opportunities in reuse, refurbishment and remanufacturing and a US$324 billion ASEAN economic growth opportunity.27
- Invest in nature-based solutions (NbS): NbS are actions that companies can take to incorporate the power of nature into their operations to lower emissions, increase resilience and reduce disaster risk while providing environmental and social advantages that pay off financially.28 The United Nations (UN) estimates that these solutions have the potential to remove up to 12 gigatons of CO2 equivalent per year, boosting climate resilience and providing an additional US$2.3 trillion in productive growth to the global economy.29
- Tap into climate tech: Businesses can help create a market for climate tech by becoming early-stage customers. Companies can tap into this growth market by establishing a venture capital arm to invest in climate tech companies while using their products and services to reduce GHG emissions. Moreover, deploying climate tech across group portfolios can help portfolio companies and suppliers on their decarbonisation journey.
- Apply climate adaptation methods: Both the public and private sector will need to invest in climate adaptation measures to reduce the negative impacts of climate change. The World Economic Forum predicts that climate adaptation could spur an additional US$4.3 trillion of revenue and 232 million new jobs by 2030.30 Climate adaptation is expected to fuel jobs growth in areas such as the design and creation of new construction materials, risk modelling, early warning systems, climate risk insurance, flood management structures, and agriculture (including the development of climate-adaptable seed and plant varieties).
To limit global warming to 1.5°C above pre-industrial levels, there is an enormous amount of courage, vision and work required. The gap between where we are today and where we need to be is daunting, and marks the need for a new era of significant business and economic transformation. The question is, which companies will be the winners and losers in the net zero economy transition?
Climate and sustainability insights
Businesses are facing pressure to rethink their operations in the context of sustainability - reducing carbon emissions in line with net zero targets, providing better sustainability reporting and transparency, and adapting to unavoidable climatic risks.
The Energy Transition
Make your energy transition add up to more. From greener supply to leaner demand—delivering radical decarbonisation by scaling up renewables, building greener and operating smarter.


