


Working capital performance has declined by 7.1% since FY 2014 for listed companies in Middle East
Yet for another year, listed companies in the Middle East have up to AED 121 billion of excess cash trapped on their balance sheet in their operational working capital.
Working capital is more important than ever now, as our study shows increasing pressures on the margins with the EBITDA margin declining for 5 consecutive years at a 8.1% compounded decline rate. Working capital remains the cheapest source of cash and with margins under pressure, cash flows are suffering leaving businesses with no other option than to cut CAPEX expenditure, slow down dividend payouts or seek funding from shareholders in the form of equity or externally as debt.
Working capital performance at its lowest point in 5 years despite another year when companies have stretched the creditors’ cycle (accounts payable). Continuing this trend of stretching payables to suppliers will be damaging to the local economy, with smaller players suffering the most and going out of business due to cash flow pressures. There are more sustainable and efficient ways of addressing operational efficiencies in inventory and accounts receivables, which could release working capital pressure for Middle East corporates.
Around 49% of the companies have improved their working capital year on year, however, sustainable working capital improvement remains elusive for the vast majority of Middle East companies. Only 6% of companies in our survey sustainably improved working capital days for 3 consecutive years, and a mere 2% for 4 consecutive years.
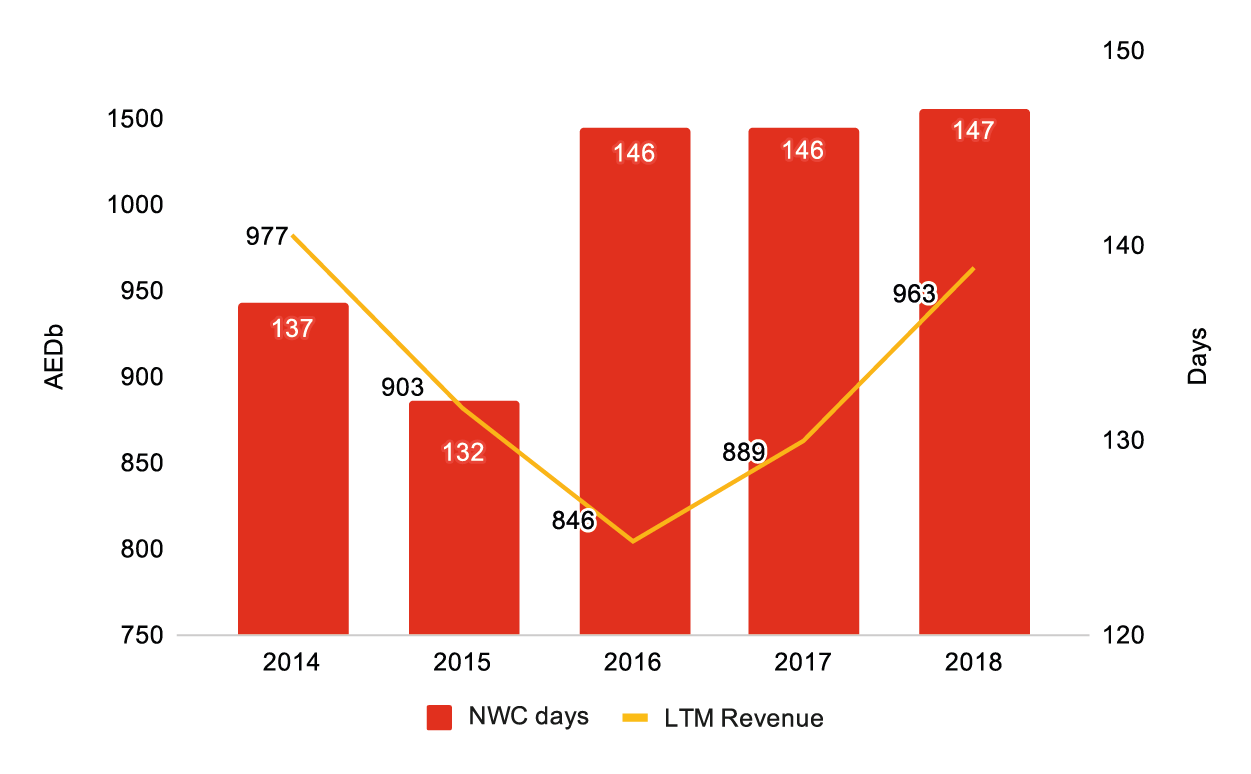
Working capital days trend
The average working capital efficiency in the Middle East has had a deteriorating trend since 2014. During 2014-2018, Net Working Capital (NWC) days have declined by a compounded rate of 1.7%, which corresponds to c. AED 25 bn of additional cash tied up in operations by listed companies in the Middle East.
Similar to last year’s study, companies continue to resort to stretching supplier payments in order to reduce the impact of the deterioration in the other cycles.
The inability of companies to tackle inventory improvements is not new to the Middle East, as this is one of the most complex areas of working capital with multiple internal factors and external ones influencing the overall levels of inventory.
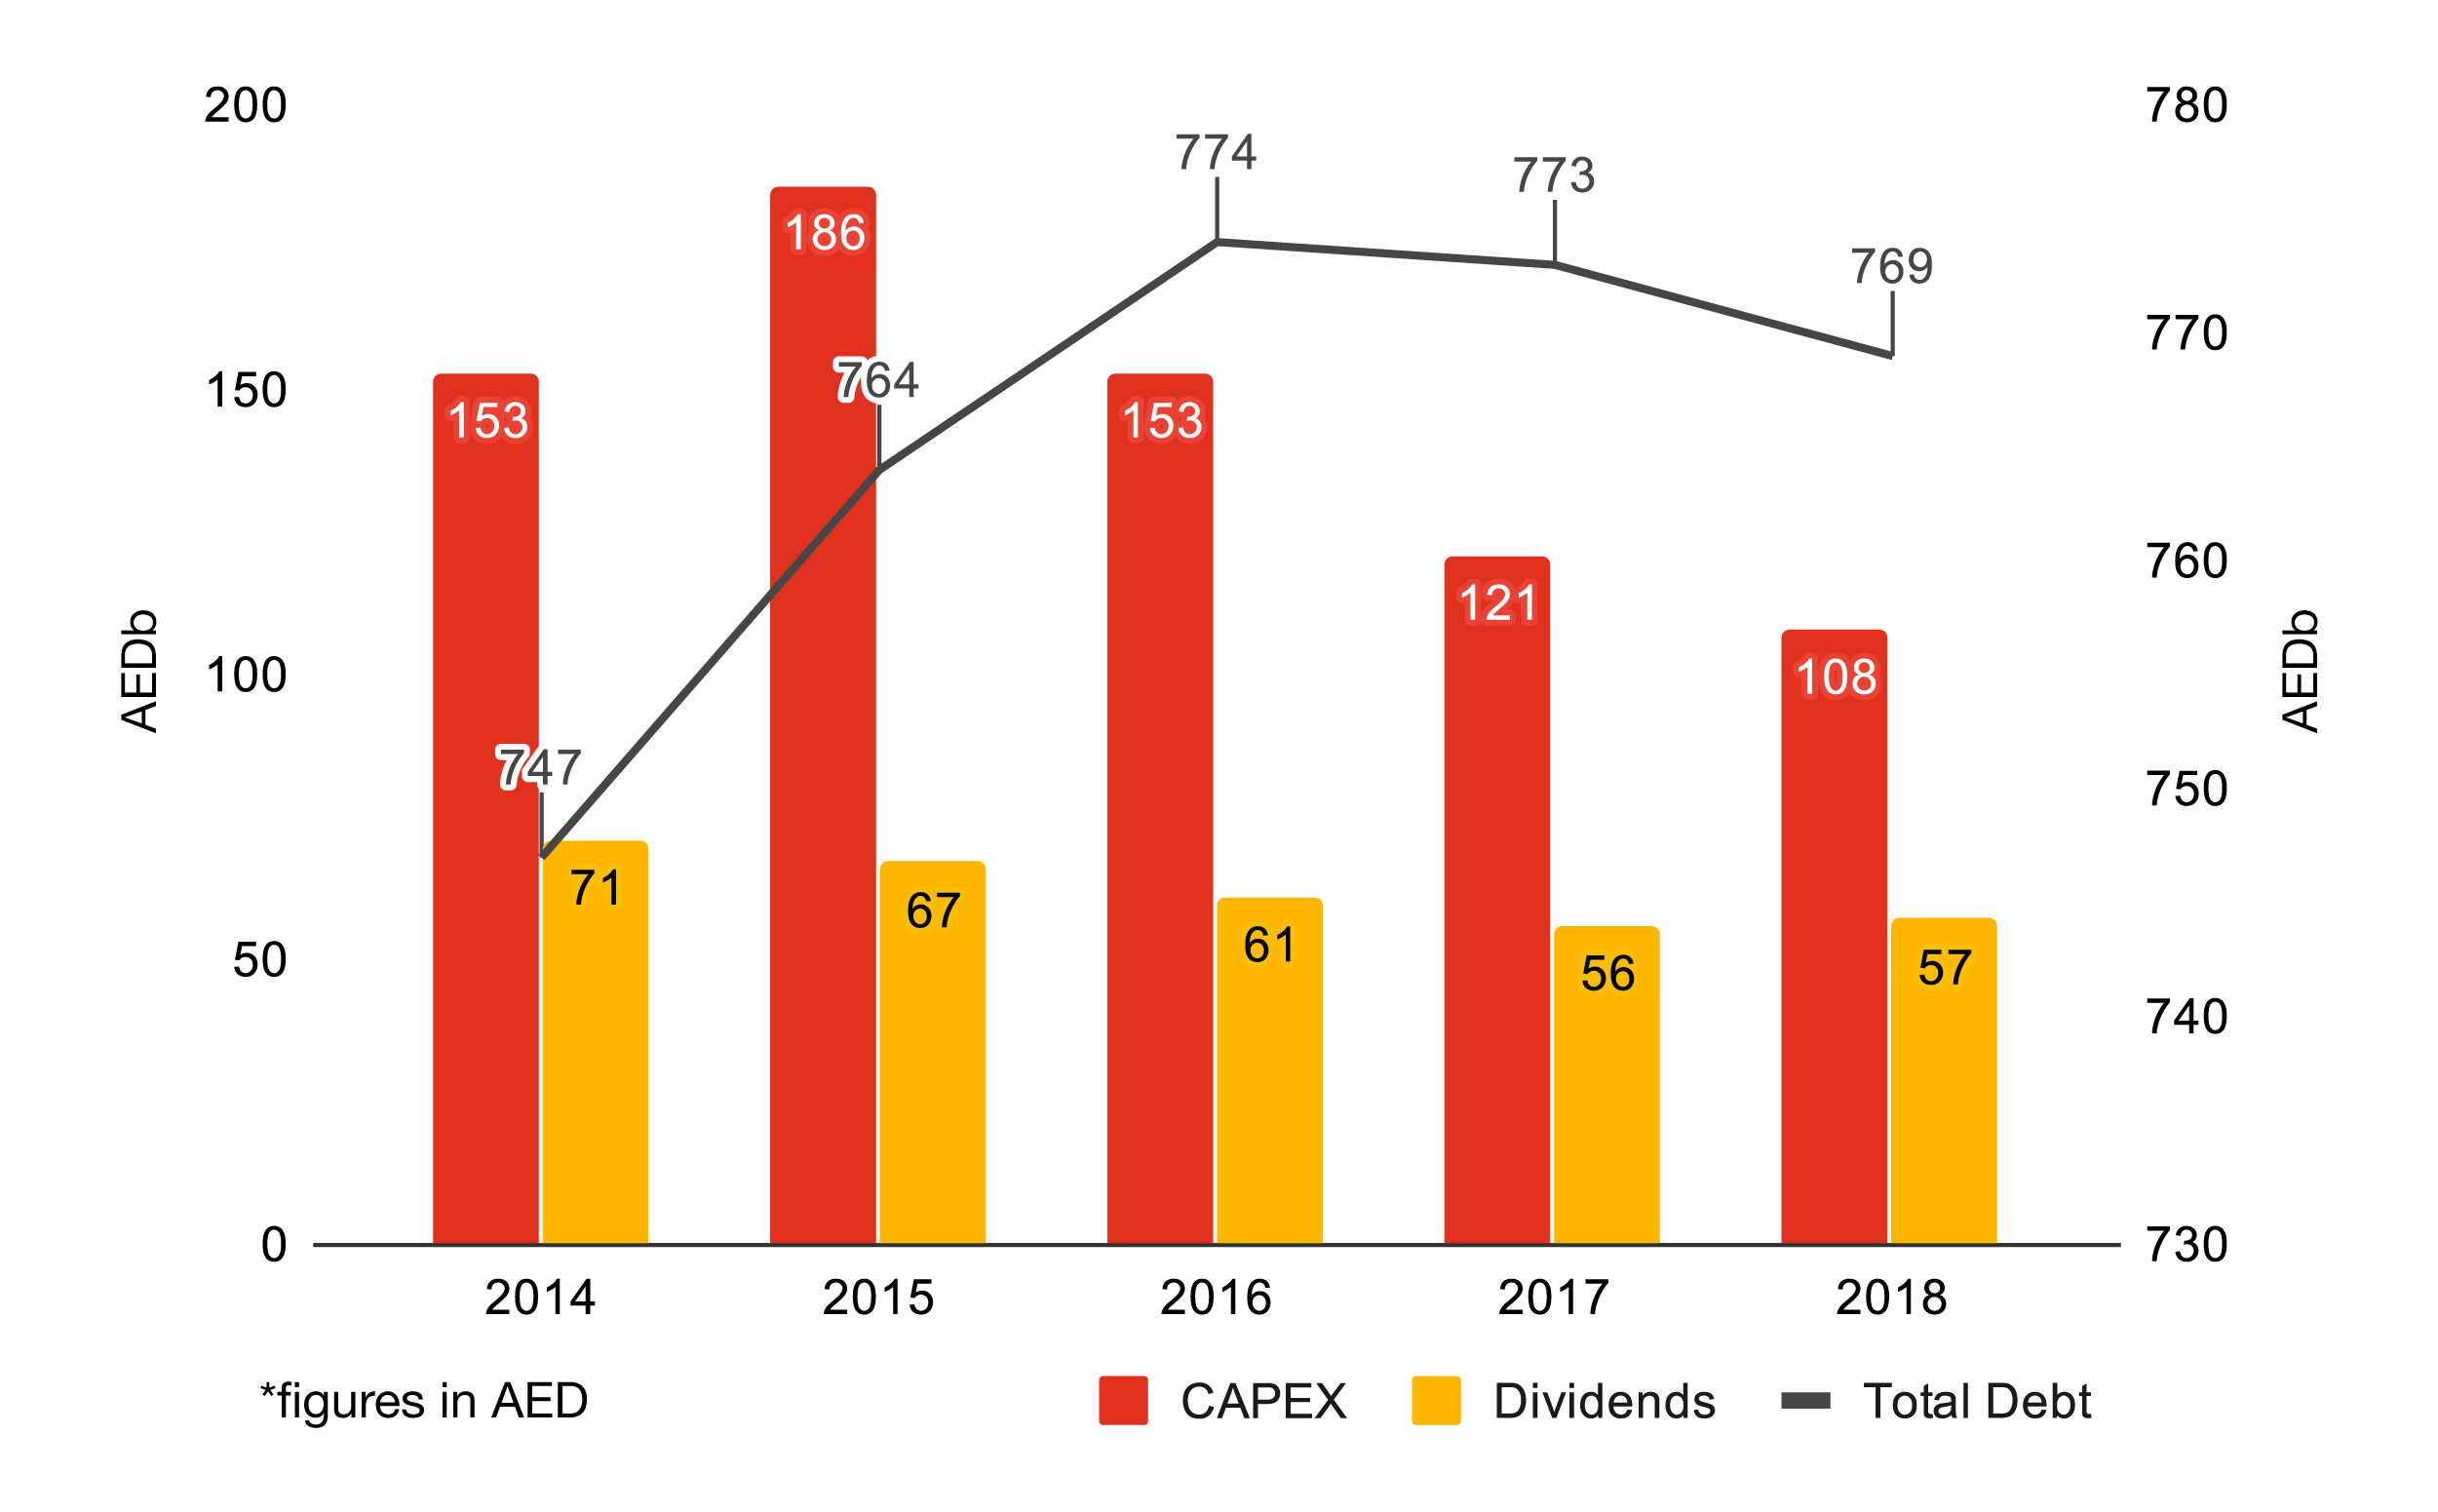
Due to current macroeconomic trading conditions and poor access to suitable finance options, businesses have avoided increasing their leverage, so debt levels remained stable.
But With margins under pressure and inability to release cash trapped in the operational working capital cycles, companies have continued to cut their CAPEX spend yet again and have not increased the year-end payouts to their shareholders.
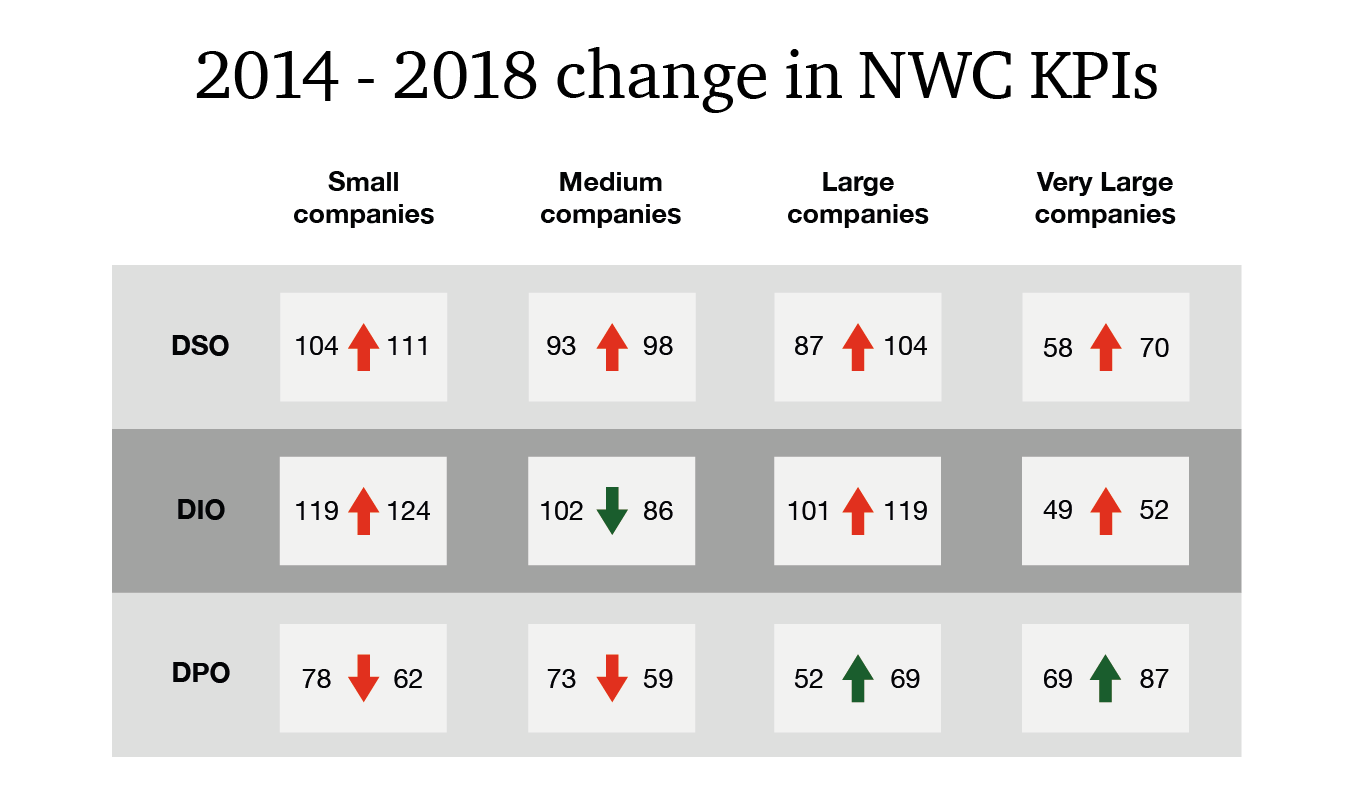
DSO, DIO and DPO trends
Days inventory outstanding (DIO) has been the main driver of year on year deterioration of working capital efficiency with 4 days (4%) increase. Days sales outstanding (DSO) has remained stable at the highest point in 5 years, as companies struggle to enforce and operationalise credit policies and effective collection strategies.
There are notable differences in collection speed based on the company size, where very large corporates collect on average 30% quicker than the rest of the businesses and up to 50% faster compared to small companies. We are noticing an improvement year on year for most of the Business to Customer (B2C) sectors (Retail, Hospitality & Leisure, Energy and Utilities or Communications), but the Business to Business (B2B) sectors are mostly deteriorating with Engineering and Construction , Healthcare (insurance based payments) and Industrial Manufacturing.
DIO has increased in most sectors , both B2C and B2B, showing again challenges from businesses to predict their future demand and plan purchases or production accordingly. We are seeing more and more acute issue with the mix of inventories, where fast selling products are performing well but the longer tail causes the issues. Similarly a lot of clients are facing issues due to long and burdensome internal processes and approvals increasing the end to end lead times.
The creditors cycle remains the go to areas of working capital for corporates in the Middle East to drive improvements. Yet another year where credits are stretched not only by very large corporates but across the board at all sizes, sectors and countries. We are noticing an increasing trend of poor behaviour in delaying payments to suppliers rather than addressing other options in the debtors or inventory cycle or even using financial products to help extend the creditors cycle whilst actually helping the suppliers access cash quicker.
With a significant portion of international spend typically based on letters of credit, underlying non-international creditor days are significantly greater, creating a more acute cash pressure on local suppliers which in turn affects the health of the local economy overall.
We have seen a number of good initiatives from the UAE government forming committees which shall address the complaints around late payments, but these are all in their incipient stages.


Quartile performance trend

The evolution of NWC days trend over the period shows top performers increasing their gap to the median cohort, which in turn are continuing to increase the gap to the bottom performers both down to their improved working capital efficiencies but mainly down to the deterioration of the bottom performers.
Poor performers have deteriorated 10 days since 2014 converting cash 2 times slower than median and 5 times slower than the top performers.
This analysis takes away the element of company size driving improvements and shows any company regardless of its size can perform better even than its larger peers, if the right focus is placed on the underlying operational processes driving the working capital cycle across debtors, inventory and creditors.
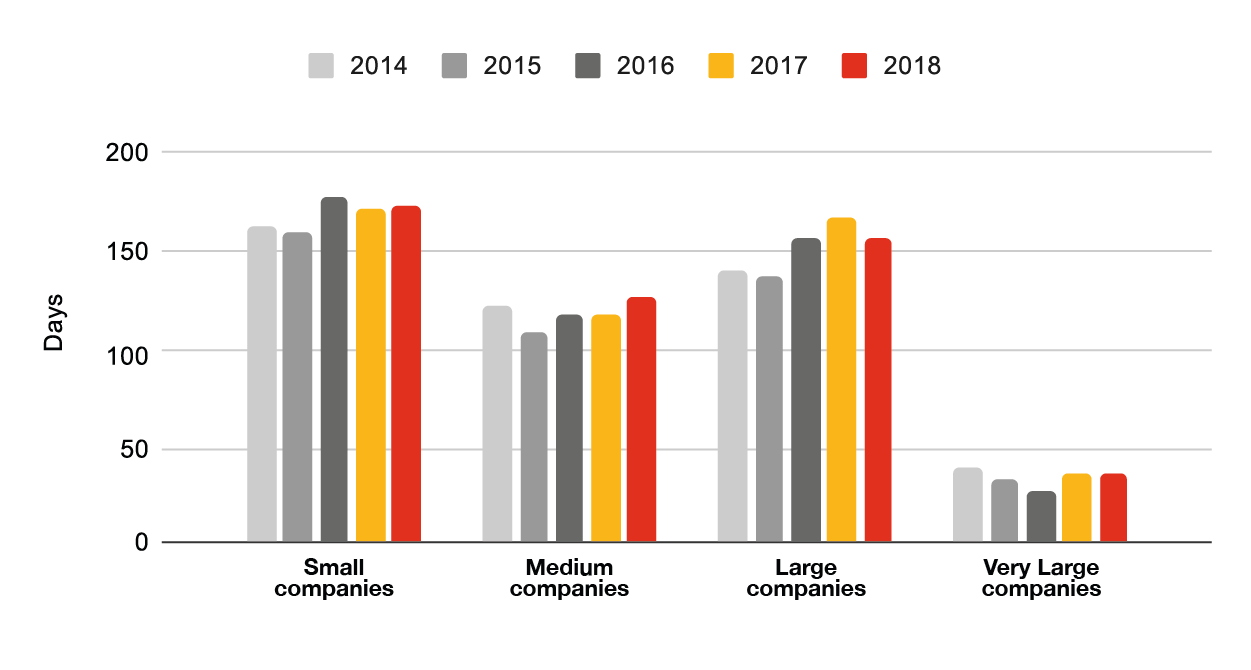
NWC development by company size category
Larger companies tend to outperform their smaller peers on working capital efficiency as they possess more resources to invest in process improvement and technologies. This is also evident from our study as the overall level of NWC days strongly correlates with company size.
NWC performance has deteriorated in 2018 for small and mid sized companies while large and very large sized companies have shown improvement in 2018. These large and very large sized companies are able to use their market power to improve NWC performance at the expense of their smaller peers. The deterioration in NWC days for small and mid sized companies is mainly driven by DIO, which increased by 5 days and improvement in NWC days for large and very large sized companies is driven by their ability to stretch the payables cycle.

NWC development by country
Companies in all key countries in the region besides the UAE have seen their average NWC days deteriorate in 2014-2018.
NWC performance in UAE has modestly improved during the study period driven by Days Payables Outstanding (DPO), which has gone up by a compounded annual rate of 7% in 2014-2018 with 14 days increase in 2018 (versus the prior year). This indicates that instead of driving process improvements across cash collections and inventory management, the UAE companies have improved their NWC performance through adding more pressure on their supply chain. This pressure is evident in the local economy prompting UAE government taking active steps to release timely payments to suppliers.
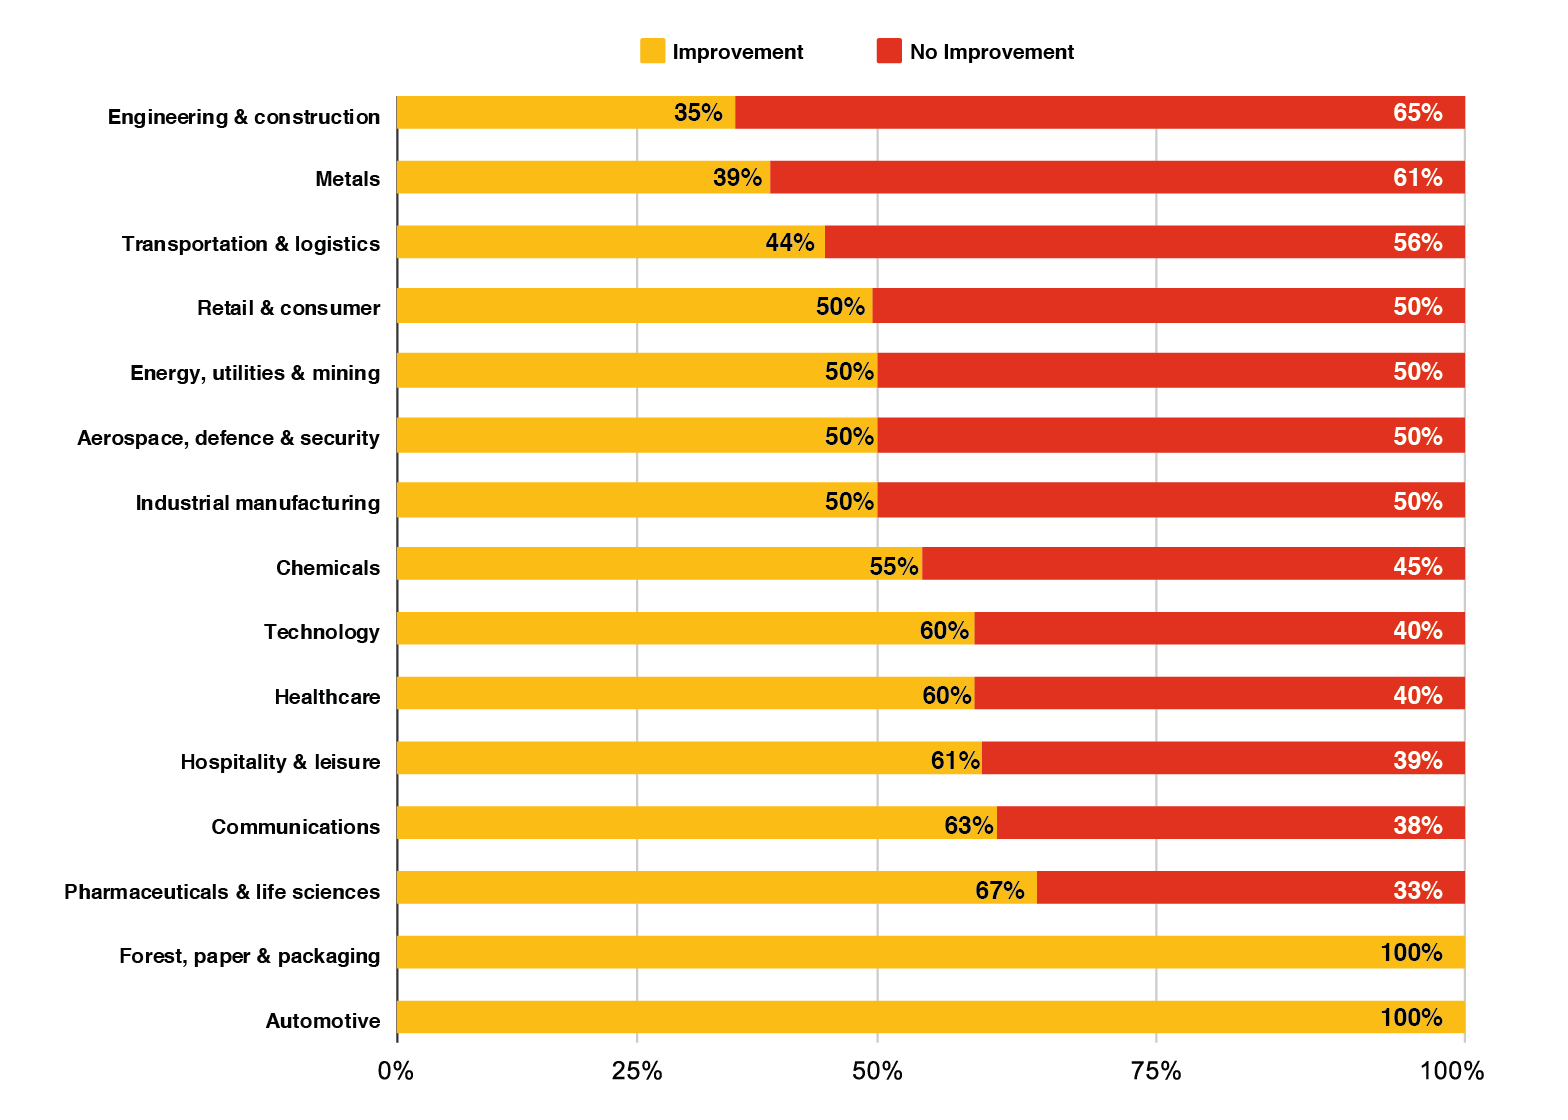
NWC development by industry
Seven out of the 15 industries covered show more than 50% of companies deteriorated working capital performance. The Engineering and Construction sector had the poorest performance with 65% of the companies showing deterioration in working capital performance, followed closely by the Metals sector with 61%.
Irrespective of sector, and whilst there are a number of external factors that can influence working capital, management focus can have a significant impact on its performance.
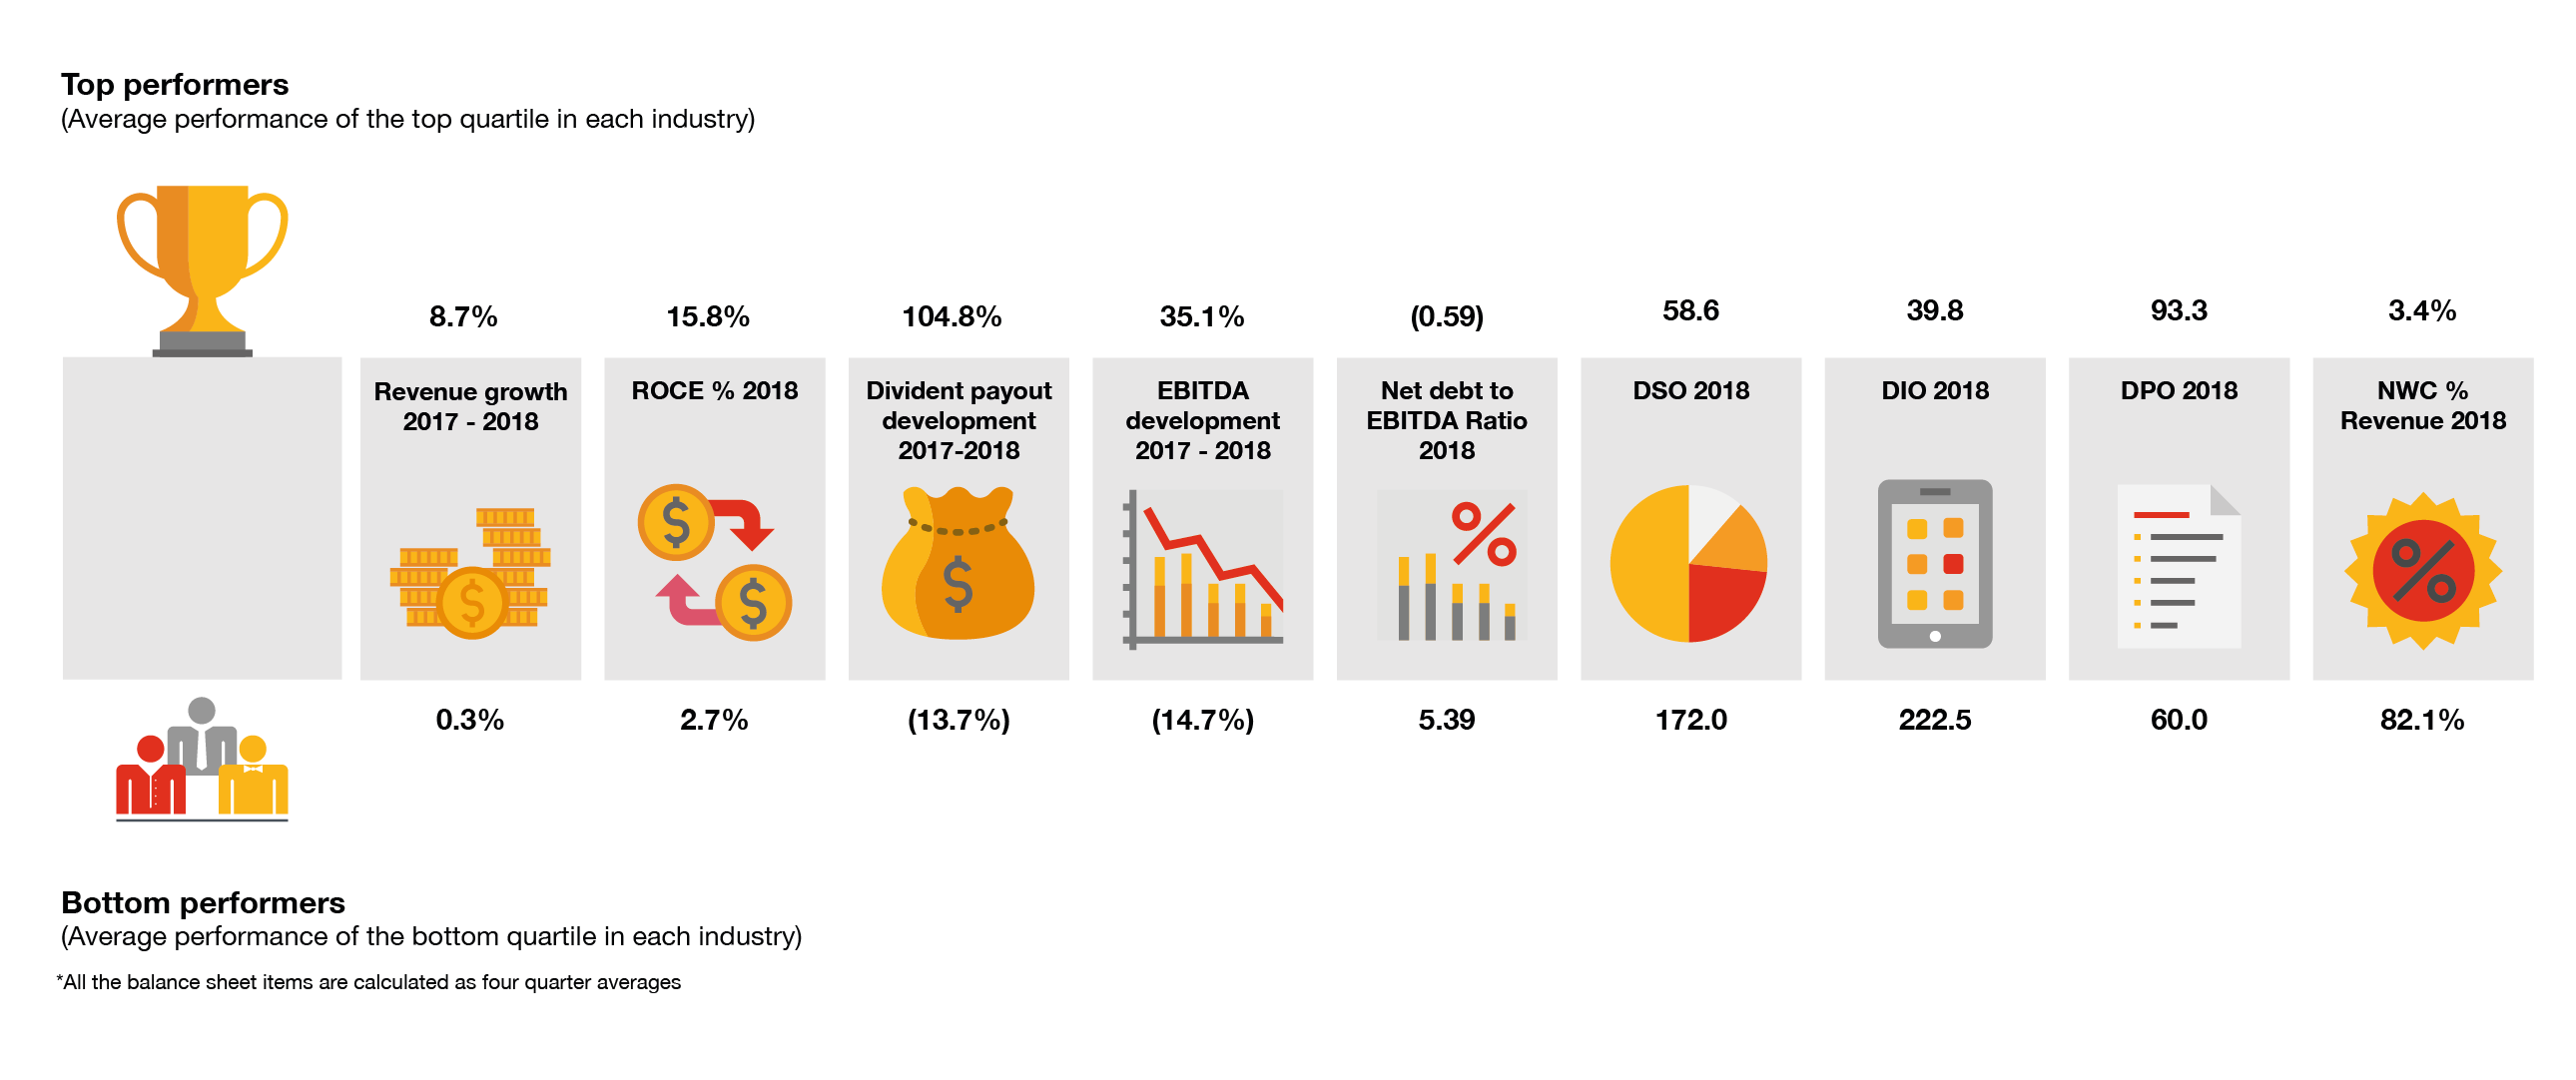
Top vs. Bottom working capital performers
Improving working capital performance has positive impacts beyond cash release, as the improvements typically come from underlying process improvements, increased efficiencies or changes in the strategy and operating models which will have an indirect or direct impacts on other company metrics.
Our findings suggest that top performers within different industries have been able to increase revenue and profits significantly more than their peers with weaker working capital performance.
In addition, the top performers have been able to deliver a better return to shareholders on the capital employed (6 times better Return on Capital Employed - ROCE), as well as significant year on year improvement on dividends payouts from 2017 to 2018, compared to a deterioration for the bottom performers which had to reduce their payouts to shareholders at year end.
Cash collection is a growing problem for companies in the Middle East. Our study reveals that top NWC performers collect cash three times faster than their competitors suggesting that ensuring efficient cash collection is high on management's agenda in top-performing companies.


Benchmarking
Complete a working capital benchmarking exercise to compare performance against peers and identify potential improvement opportunities.

Diagnostics
Perform a diagnostic review to identify ‘quick wins’ and longer-term working capital improvement opportunities.

Roadmap Definition
Develop detailed action plans for implementation to generate cash and make sustainable improvements.
Implementation
We take a hands-on approach to change operational behavior 'on the shop floor'. We provide a proven toolkit and expertise to support management in driving sustainable improvements. Typically, achieved improvements range from 15-30% of existing working capital.
Disclaimer
This study provides a view of the Middle East working capital performance and is based on the financial results of 389 publicly listed companies across the Middle East. The countries covered include: Bahrain, Egypt, Jordan, Kingdom of Saudi Arabia, Kuwait, Oman, Qatar and United Arab Emirates. All currencies have been converted to UAE dirhams at historical rates. The financial services, real estate and insurance sectors are excluded. All financial data has been downloaded in a standardised format from S&P Global Market Intelligence.
Limitations
Companies have been assigned to countries based on the location of their headquarters. Although a significant part of their sales and purchases might be realised in that country, it does not necessarily reflect typical payment terms or behaviour in that country. As the research is based on publicly available information, all figures are financial year-end figures. Off-balance sheet financing or the effect of asset securitisation have not been taken into account.
Contact us
Dan Georgescu
Director, Performance and Restructuring Services, PwC Middle East
Tel: +971 5 6418 9776


