A time for hope: Consumers’ outlook brightens despite headwinds

December 2021 Consumer Insights Pulse Survey

In December 2021 Global Consumer Insights Survey, we surveyed 9,370 people in 26 territories or countries. 76% of respondents reporting being at least partially vaccinated, consumers are planning to spend more, and they are seeing improvements in their lifestyle as employers allow new ways of working. Of course, some things never change: when it comes to shopping, price and convenience still matter most, even as other factors, such as sustainability, are increasingly on consumers’ minds.

Here are six of the most significant findings.

Vaccination status and flexible workstyle influence consumer optimism  

  • Overall, 61% of respondents are optimistic about the future, and only 18% are not.
  • Vaccination against COVID-19 is a major driver of optimism. Sixty-six percent of vaccinated respondents are optimistic about the future, compared with 43% of unvaccinated respondents.
  • Optimism seems to be manifesting in spending, too. Respondents say they’ll spend more across categories over the next six months, with 41% predicting increased spending on groceries, 33% on fashion, and 30% on health and beauty.
  • Flexible work also drives optimism. Survey respondents who work from home are 10 percentage points more optimistic than those who work away from home. And those who can work in a hybrid way are 9 percentage points more optimistic than those who are required to either be at home or in an office all of the time. 
 

Millennials, city dwellers, those working mostly from home or in a hybrid way, and those who are vaccinated are the most optimistic cohorts. Presumably, because optimism is partly tied to vaccination rates, the climbing global vaccination rate will bode well for consumer confidence heading into 2022.

It's particularly important for business leaders to note the factors influencing optimism that they can control or affect, such as flexible work and vaccination. Supportive workplace policies that facilitate health and well-being will not only help companies rewrite the social contract with their people but could also create a ripple effect of activity and spending that yield business benefits.

Impact of vaccination status on optimism for the future
Optimisticthumbs up 66% At least partially vaccinated 43% Not Vaccinated
Not optimisticthumbs down 16% At least partially vaccinated 27% Not Vaccinated
Bases: At least partially vaccinated (7,123); not vaccinated (1,311); all respondents who are employed (7,047); working from home (2,738); working away from home (2,671); hybrid (2,988); non-hybrid (3,901). Hybrid means able to work in any location or at home all of the time. Note: 2% prefer not to say. Source: December 2021 PwC Global Consumer Insights Pulse Survey
  • Workplace location 68% from home
  • Workplace location 58% away from home
  • Working style 69% hybrid
  • Working style 60% Non-Hybrid
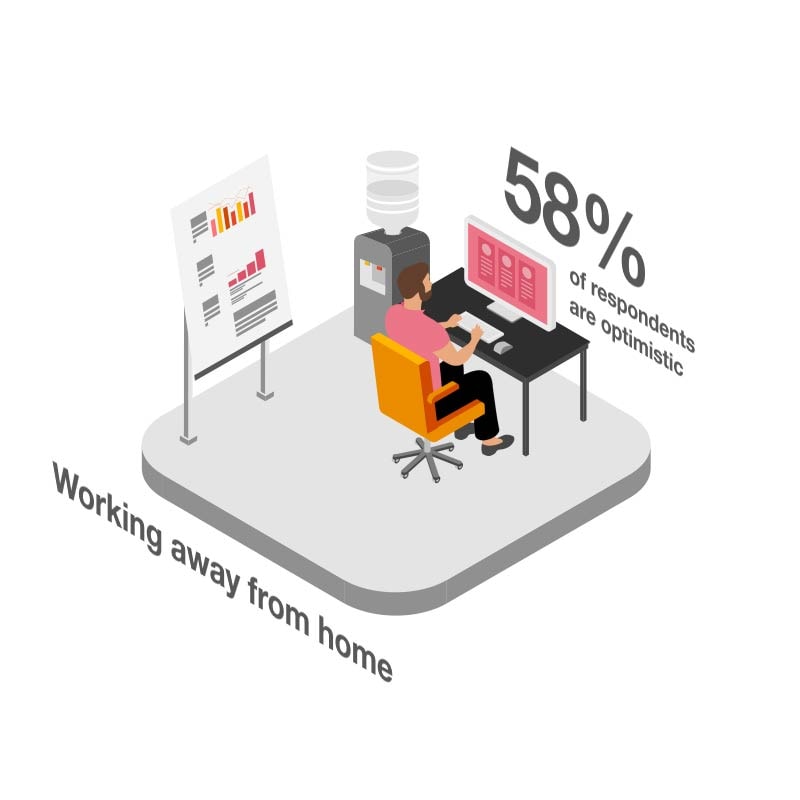
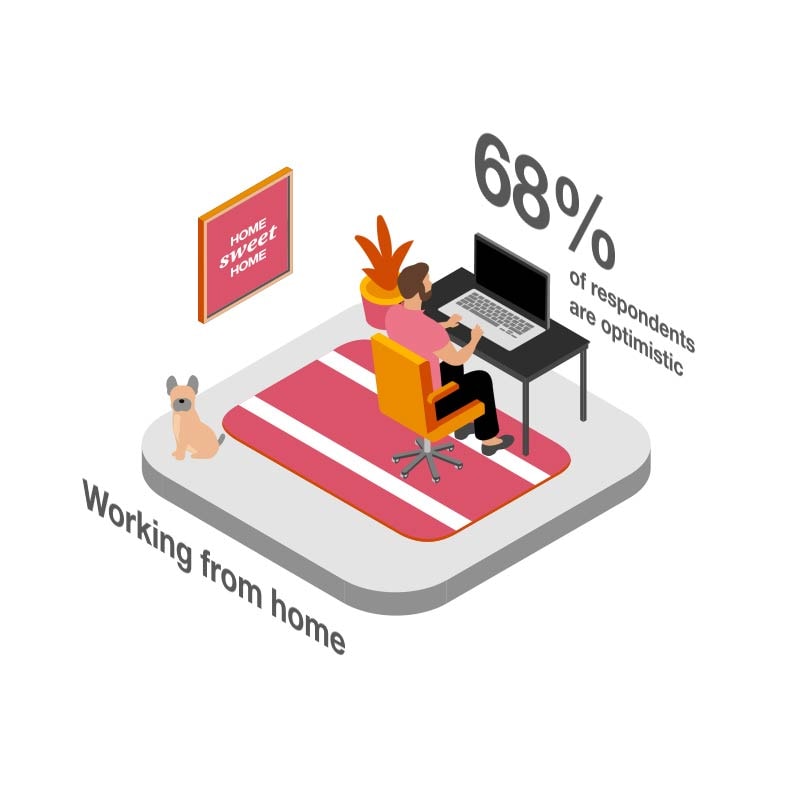
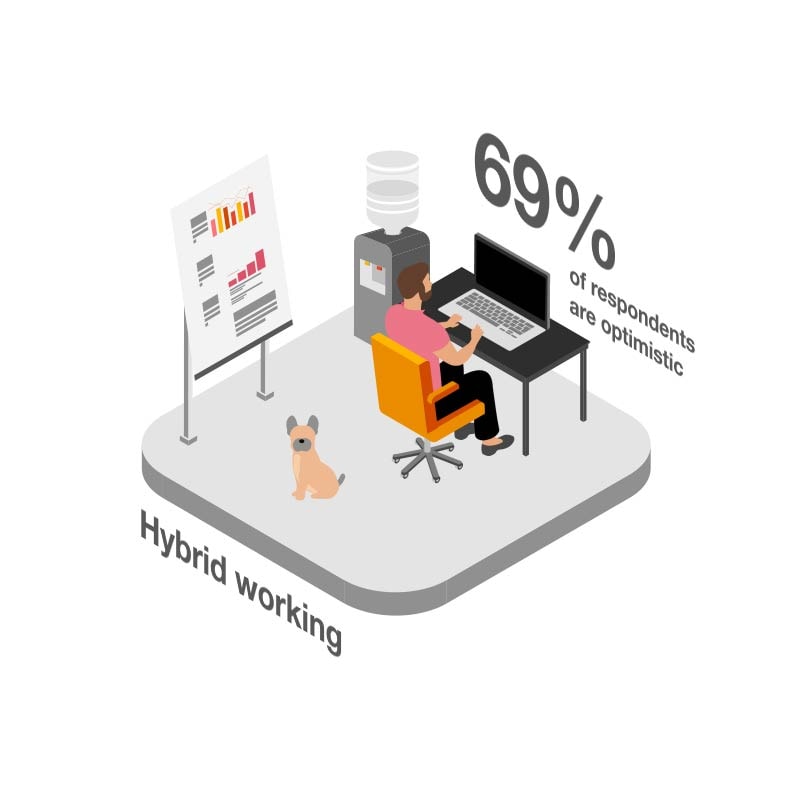
The impact of workplace and working style on optimism
Workplace location 68% from home Workplace location 58% away from home Working style 69% hybrid

Smartphone shopping is at a historic high

  • 41% of respondents say they shop daily or weekly via mobile or smartphone, compared with 39% six months ago and 12% five years ago.
  • In-store shopping has recovered to pre-pandemic levels: 47% say they shop in-store daily or weekly, compared with 45% six months ago and 41% just after the pandemic had hit.
  • More than half never use a smart home voice assistant or wearable device to shop (56% and 62%, respectively).

Mobile or smartphone shopping is far and away the most popular online shopping mode, with at least 10 percentage points (and as many as 25) separating it from PCs, tablets, smart home voice assistants and wearable devices. It also has been gaining ground on in-store shopping. Only 6 percentage points separate mobile shopping from in-store shopping. We expect mobile shopping to continue to close in on in-store shopping in coming months and years.

For leaders looking to drive customers either into brick-and-mortar stores or online, analysis of our survey findings uncovered specific factors that are strongly linked with a proclivity to shop one way or the other. For instance, making purchases possible via social media could help drive greater propensity to shop online, as could offering efficient delivery or collection services. However, having a variety of physical retailers conveniently situated to meet consumers’ needs could drive greater frequency of in-store shopping, as could independent and local shops versus chain stores.

To succeed in a digital world, companies will need to take advantage of new technology, not to copy what everyone else is doing but to advance their own mission by investing in the differentiating capabilities that allow them to deliver on their purpose. Filling their new place in the world might require them to shed old business models, assets and beliefs about value creation.

In the last 12 months, how often have you bought products (e.g. clothes, books, electronics) using the following shopping channels?
Enable javascript to see our interactive graphics or scroll down to see the raw data in the table
Note: Not including grocery. 2020 not included, as different sampling was used. Year of data relates to year of publication (e.g. March 2021 data collected in late 2020, published in March 2021. Source: December 2021 PwC Global Consumer Insights Pulse Survey
  Global Australia Brazil Canada China Egypt France Germany Hong Kong, SAR India Indonesia Ireland Japan South Korea Malaysia Mexico Philippines Qatar Russia Saudi Arabia Singapore South Africa Spain Thailand United Arab Emirates United States Vietnam
In the last 12 months, how often have you bought products (e.g. clothes, books, electronics) using the following shopping channels?
Respondents who answered daily/weekly
In-store 47%, 45%, 41%, 49% 52%, 50%, 55%, 55% 33%, 26%, 24%, 30% 53%, 45%, 41%, 50% 50%, 53%, 49%, 52% 41%, 57%. 40%, 48% 53%, 47%, 40%, 46% 48%, 41%, 35%, 59% 60%, 50%, 61%, 63% 53%, n/a, n/a, n/a 46%, 45%, 34%, 52% 46%, n/a, n/a, 54% 43%, 43%, 40%, 41% 34%, 35%, 35%, n/a 50%, 51%, 39%, 55% 50%, 39%, 36%, n/a 46%, 39%, 41%, 55% 46%, n/a, n/a, n/a 50%, 43%, 41%, 66% 56%, 59%, 56%, 53% 48%, 54%, 46%, 51% 32%, 37%, 37%, 46% 47%, 50%, 35%, 48% 50%, 50%, 37%, 55% 53%, 51%, 42%, 61% 55%, 55%, 48%, 56% 67%, 68%, 63%, 76%
Mobile or smartphone 41%, 39%, 33%, 24% 43%, 40%, 34%, 25% 42%, 31%, 30%, 26% 27%, 28%, 25%, 15% 61%, 61%, 57%, 55% 37%, 49%, 38%, 29% 31%, 35%, 26%, 18% 35%, 31%, 23%, 23% 40%, 29%, 40%, 30% 53%, n/a, n/a, n/a 54%, 54%, 43%, 37% 33%, n/a, n/a, 20% 19%, 21%, 13%, 16% 59%, 56%, 53%, n/a 51%, 42%, 40%, 27% 39%, 37%, 28%, n/a 52%, 41%, 35%, 22% 39%, n/a, n/a, n/a 30%, 22%, 24%, 24% 49%, 45%, 41%, 34% 46%, 54%, 43%, 27% 30%, 33%, 24%, 17% 33%, 34%, 31%, 20% 49%, 52%, 37%, 36% 48%, 48%, 42%, 33% 36%, 40%, 39%, 24% 69%, 59%, 54%, 55%

Comma separated values represent:

  • Dec 2021
  • June 2021
  • March 2021
  • 2019

Data privacy is key to consumer trust

  • 59% of respondents say they’ve become more protective of their personal data over the past six months.
  • Data security has a far greater impact on trust than any other factor.
  • Environmental, social and governance (ESG) factors are not the greatest drivers of trust.
  • About three-quarters of respondents believe companies are ‘doing the right thing,’ but only about a quarter, across sectors, believe this ‘to a great extent.’


Companies that seek personal information so they can better tailor products and experiences and target consumers must be mindful of the criticality of keeping that information secure. Businesses should also note that our survey shows that using customer data to personalise experiences is less likely to help build trust with them than using data to personalise discounts and recommendations.

Our survey findings also show that although ESG issues are important to consumers, when it comes to trust, factors such as meeting expectations and making purchasing easy—which affect consumers in a more obvious, direct way—matter most. Businesses can build a system of privileged insights, but only if the value they offer in exchange resonates with consumers and consumers trust them to make good use of their data.

Building on this foundation, companies can then focus on solving their customers’ most important problems—for example, by listening to customers across the entire spectrum of their interactions. Businesses can use the privileged insights they gain to systematically strengthen their value propositions, capabilities systems, and products and services offered.

It’s heartening to see that consumers generally believe companies are living up to their purpose and promises. The most trusted sectors in this regard are food and beverage, healthcare, and technology. Healthcare has the greatest number of respondents believing in them ‘to a great extent’ (31%), compared with technology (27%), and food and beverage (26%).

Thinking about a brand that you regularly buy products/services from, to what extent do the following impact how much you trust the brand:
Enable javascript to see our interactive graphics or scroll down to see the raw data in the table
Base: All respondents (9,370). Source: December 2021 PwC Global Consumer Insights Pulse Survey.
  Global Australia Brazil Canada China Egypt France Germany Hong Kong, SAR India Indonesia Ireland Japan South Korea Malaysia Mexico Philippines Qatar Russia Saudi Arabia Singapore South Africa Spain Thailand United Arab Emirates United States Vietnam
Thinking about a brand that you regularly buy producdts/services from, to what extent do the following impact how much you trust the brand?
Respondents answering "To a great extent"
Protects my personal data 47% 38% 58% 45% 50% 62% 33% 32% 28% 54% 61% 47% 28% 27% 53% 62% 71% 67% 42% 54% 38% 67% 51% 41% 49% 46% 64%
Always meets my expectations 39% 35% 47% 37% 44% 43% 29% 30% 33% 48% 46% 37% 18% 26% 35% 54% 56% 57% 41% 46% 29% 55% 45% 33% 42% 36% 48%
Provides exceptional customer service 38% 32% 47% 36% 41% 46% 25% 27% 27% 43% 52% 38% 15% 24% 34% 54% 65% 54% 35% 35% 28% 60% 45% 38% 36% 37% 53%
Shares relevant discounts/recommendations to me 36% 31% 46% 30% 31% 42% 25% 25% 32% 46% 46% 34% 16% 27% 39% 45% 54% 53% 43% 38% 29% 51% 39% 33% 35% 32% 42%
Makes it easy for me to make repeat purchases 35% 28% 44% 27% 38% 43% 24% 31% 26% 49% 41% 31% 20% 24% 38% 42% 52% 49% 35% 37% 30% 55% 31% 30% 42% 32% 41%
  Global Australia Brazil Canada China Egypt France Germany Hong Kong, SAR India Indonesia Ireland Japan South Korea Malaysia Mexico Philippines Qatar Russia Saudi Arabia Singapore South Africa Spain Thailand United Arab Emirates United States Vietnam
Thinking about a brand that you regularly buy producdts/services from, to what extent do the following impact how much you trust the brand?
Consumers who say they have been more protective about their data in the last six months
I am protective of my personal data 59% 51% 73% 49% 65% 67% 42% 44% 56% 75% 79% 51% 27% 52% 74% 75% 83% 81% 54% 67% 68% 74% 56% 65% 70% 56% 71%

Consumers care more about sustainability than ever before

  • 52% of respondents say they are more eco-friendly than they were six months ago. This statistic has ticked up by 2 percentage points since our June 2021 Pulse survey.
  • About half of respondents consciously consider factors related to sustainability when making purchasing decisions.
  • Those who work from home are 10 percentage points more likely than those who work away from home to consider sustainability factors when shopping.


Consumers today describe themselves as increasingly eco-friendly. For example, 51% of respondents say that when considering a purchase, they factor in whether the product was produced with a traceable and transparent origin. It’s intriguing that those who work from home show more interest in sustainable shopping. It could be because at-home workers tend to be more white-collar and affluent, with more financial freedom to be selective in their purchasing choices. It could also be that the smaller carbon footprint inherent in working from home has led to more heightened awareness about how shopping habits affect the planet. 

Before considering/making a purchase with a retailer, how often do you consciously consider the following factors?
Enable javascript to see our interactive graphics or scroll down to see the raw data in the table
Base: All respondents (9,370). Source: December 2021 PwC Global Consumer Insights Pulse Survey.
  Global Australia Brazil Canada China Egypt France Germany Hong Kong, SAR India Indonesia Ireland Japan South Korea Malaysia Mexico Philippines Qatar Russia Saudi Arabia Singapore South Africa Spain Thailand United Arab Emirates United States Vietnam
Before considering/making a purchase with a retailer, how often do you consciously consider the following factors? The retailer you are purchasing from.
Respondents answering "very often or often"
Has strong company values and is committed to doing the right thing 53% 48% 68% 42% 61% 67% 40% 45% 46% 75% 67% 39% 29% 37% 59% 69% 78% 69% 40% 69% 44% 64% 45% 67% 69% 45% 77%
Is supporting local communities 48% 47% 56% 40% 58% 58% 38% 41% 44% 68% 68% 40% 26% 29% 59% 57% 72% 63% 34% 62% 39% 57% 46% 68% 56% 40% 67%
Is taking responsibility for staff well being 50% 45% 61% 40% 58% 61% 42% 46% 40% 68% 63% 44% 23% 33% 61% 67% 75% 68% 38% 69% 41% 56% 46% 68% 59% 45% 70%
Is helping you make healthier/better lifestyle choices 55% 48% 61% 44% 66% 71% 42% 41% 46% 76% 78% 45% 35% 47% 65% 64% 78% 71% 48% 67% 47% 63% 47% 77% 66% 44% 77%
Produces items with a traceable and transparent origin 51% 47% 60% 38% 62% 68% 48% 45% 52% 65% 64% 41% 27% 47% 55% 51% 67% 66% 46% 63% 39% 54% 44% 68% 62% 36% 81%
Produces biodegradable/eco-friendly products 47% 46% 51% 38% 58% 55% 42% 36% 44% 72% 62% 38% 26% 37% 50% 51% 65% 57% 36% 57% 41% 51% 36% 66% 61% 36% 76%

But price and convenience still matter most

  • Almost 70% of respondents prioritise getting the best deal when shopping either in-store or online.
  • More than half say an efficient delivery or collection service is ‘always’ or ‘very often’ important.
  • ESG factors are middle-of-the-road priorities compared with price and convenience.


Consumers care about ESG factors, but when stacked up against the basics of price and convenience, ESG fades in importance. Consumer businesses need to take these statistics to heart, because they’ve been consistent for years. People want to do the right thing for society and for the environment, but products can’t be only either affordable and easy to get or sustainable; they have to be both.

Even when it comes to other factors in the shopping experience, such as trust in a brand, price is a key consideration. For example, 36% of respondents say that a company’s use of personal data to offer them tailored discounts or recommendations affects their trust in the brand, but only 22% say the same about using personal data to tailor their customer experience.

Considering your general shopping behaviour in physical stores or online, please indicate how often you are shopping in the following ways.
Enable javascript to see our interactive graphics or scroll down to see the raw data in the table
    Base: All respondents (9,370). Source: December 2021 PwC Global Consumer Insights Pulse Survey.
      Global Australia Brazil Canada China Egypt France Germany Hong Kong, SAR India Indonesia Ireland Japan South Korea Malaysia Mexico Philippines Qatar Russia Saudi Arabia Singapore South Africa Spain Thailand United Arab Emirates United States Vietnam
    Q: Shoppers who said they are always or very frequently buying in the following ways online
    Shoppers who said they are always or very frequently buying in the following ways online
    I am actively seeking the best deal 69% 72% 79% 69% 58% 69% 65% 60% 62% 80% 80% 77% 43% 61% 77% 68% 82% 83% 70% 75% 70% 82% 66% 67% 68% 71% 85%
    I am buying from retailers that provide an efficient delivery or collection service 56% 60% 69% 48% 60% 60% 50% 34% 51% 73% 64% 56% 23% 53% 68% 65% 72% 61% 50% 64% 58% 66% 48% 61% 75% 52% 72%
    I am buying eco-friendly/sustainable products 42% 39% 45% 33% 60% 51% 41% 32% 31% 69% 48% 31% 20% 33% 50% 49% 60% 52% 40% 47% 31% 48% 31% 53% 52% 33% 72%
      Global Australia Brazil Canada China Egypt France Germany Hong Kong, SAR India Indonesia Ireland Japan South Korea Malaysia Mexico Philippines Qatar Russia Saudi Arabia Singapore South Africa Spain Thailand United Arab Emirates United States Vietnam
    Shoppers who said they are always or very frequently buying in the following ways in-store:
    Shoppers who said they are always or very frequently buying in the following ways in-store
    I am actively seeking the best deal 68% 71% 79% 66% 55% 74% 63% 57% 59% 77% 70% 75% 45% 55% 73% 69% 72% 83% 69% 72% 70% 83% 66% 67% 71% 69% 75%
    I am buying from a variety of retailers to meet my needs 58% 59% 70% 52% 53% 65% 52% 55% 54% 67% 62% 60% 35% 36% 70% 65% 63% 67% 53% 66% 49% 77% 60% 58% 58% 55% 71%
    I am buying eco-friendly/sustainable products 42% 41% 46% 32% 58% 47% 41% 33% 30% 70% 49% 34% 19% 30% 47% 47% 58% 55% 40% 53% 33% 49% 29% 55% 58% 34% 67%

    Consumers are venturing out more for both work and play

    • Fewer respondents are working from home than in our June 2021 Pulse survey (42% versus 46%). And of those working from home, half can work in a hybrid way.
    • Respondents are more likely to travel than they were six months ago. For instance, 47% said they’re likely to stay in a hotel in the next six months.
    • The percentage of respondents who say they will increase spending at restaurants in the next six months increased from 26% in our June 2021 Pulse survey to 30%.
    • More than half of respondents (53%) say they shop at retailers that are local to them to meet their needs when shopping in-store.


    As consumers’ optimism re-emerges, they’re also emerging physically. Not only are global consumers more likely to travel and go to restaurants than they were six months ago, they’re also significantly more likely to go to a gym or a large arts, culture or sporting event. But the vast majority of survey respondents are still getting their entertainment at home and doing their workouts, dining and socialising with friends and family at home, too. The nesting habits that formed during the pandemic will likely stick to some degree, but our research shows a notable uptick in out-of-the-home activities, indicating we’ll likely see a hybrid home/away-from-home lifestyle re-emerge.

    It’s important to note that even when venturing out to make purchases, more than half of respondents indicate that they like to shop locally. This highlights both the effects of the pandemic and the ever-important influence of convenience. In the future, we think consumers will want some communal shopping experiences that enable them to get everything they need close to home in one-stop shopping centres that offer grocery, retail, dining and fitness facilities.

    In the next six months, how likely are you to...
    Enable javascript to see our interactive graphics or scroll down to see the raw data in the table
      Base: All respondents Mar 2021 (8,738), Jun 2021 (8,681), Dec 2021 (9,370). Source: December 2021 PwC Global Consumer Insights Pulse Survey
        Global Australia Brazil Canada China Egypt France Germany Hong Kong, SAR India Indonesia Ireland Japan South Korea Malaysia Mexico Philippines Qatar Russia Saudi Arabia Singapore South Africa Spain Thailand United Arab Emirates United States Vietnam
      In the next 6 months how likely are you to… 
      Respondents answering "very likely or likely"
      Travel via public transport 54%, 50%, 47% 48%, 48%, 48% 58%, 41%, 47% 37%, 29%, 29% 67%,74%, 71% 68%, 70%, 61% 48%, 42%, 37% 48%, 41%, 36% 70%, 68%, 71% 62%, n/a,  n/a 70%, 65%, 57% 48%, n/a,  n/a 58%, 57%, 53% 44%, 42%, 32% 50%, 41%, 44% 61%, 58%, 56% 58%, 50%, 56% 60%, n/a, n/a 55%, 62%, 57% 63%, 65%, 56% 68%, 73%, 76% 50%, 39%, 41% 60%, 52%, 47% 52%, 60%, 61% 63%, 55%, 50% 32%, 38%, 34% 63%, 72%, 73%
      Stay in a hotel 47%, 43%, 36% 44%, 48%, 41% 58%, 34%, 44% 35%, 29%, 24% 50%, 57%, 47% 59%, 63%, 48% 45%, 41%, 36% 42%, 35%, 24% 34%, 19%, 26% 60%, n/a,  n/a 63%, 57%, 50% 58%,  n/a,  n/a 33%, 32%, 28% 48%, 35%, 33% 58%, 55%, 39% 58%, 47%, 37% 33%, 34%, 33% 59%, n/a, n/a 24%, 32%, 20% 65%, 67%, 63% 36%, 43%, 36% 48%, 37%, 33% 52%, 40%, 30% 41%, 54%, 54% 62%, 61%, 49% 42%, 52%, 40% 62%, 64%, 71%
      Stay in a self-catering accommodation e.g. Airbnb, VRBO/Expedia 39%, 37%, 32% 37%, 38%, 34% 50%, 26%, 40% 26%, 21%, 19% 36%, 46%, 40% 45%, 54%, 40% 41%, 40%, 33% 30%, 32%, 21% 27%, 12%, 22% 55%, n/a, n/a 63%, 49%, 45% 40%,  n/a,  n/a 12%, 16%, 8% 48%, 40%, 37% 41%, 44%, 30% 48%, 46%, 36% 38%, 38%, 41% 47%, n/a, n/a 22%, 28%, 17% 51%, 51%, 55% 21%, 32%, 28% 53%, 52%, 45% 41%, 34%, 26% 42%, 49%, 40% 49%, 54%, 46% 27%, 37%, 33% 65%, 62%, 76%
      Travel on a domestic flight 40%, 37%, 33% 39%, 42%, 35% 55%, 34%, 39% 25%, 22%, 18% 49%, 53%, 47% 54%, 58%, 50% 29%, 28%, 26% 23%, 22%, 18% 27%, 11%, 23% 65%, n/a, n/a 63%, 54%, 50% 21%, n/a, n/a 22%, 23%, 21% 46%, 35%, 31% 55%, 46%, 36% 56%, 47%, 35% 38%, 35%, 38% 47%, n/a, n/a 30%, 44%, 27% 75%, 68%, 68% 21%, 26%, 25% 40%, 42%, 39% 42%, 30%, 26% 34%, 45%, 47% 50%, 51%, 48% 36%, 43%, 36% 68%, 72%, 77%
      Travel on an international flight 33%, 30%, 26% 29%, 24%, 26% 36%, 24%, 26% 23%, 21%, 17% 29%, 34%, 27% 48%, 56%, 49% 35%, 31%, 27% 28%, 28%, 22% 31%, 16%, 27% 53%, n/a, n/a 63%, 43%, 38% 38%, n/a, n/a 12%, 12%, 10% 30%, 27%, 24% 37%, 38%, 27% 41%, 35%, 25% 32%, 29%, 30% 73%, n/a, n/a 23%, 26%, 20% 67%, 67%, 58% 23%, 30%, 30% 26%, 26%, 23% 35%, 26%, 20% 30%, 41%, 28% 66%, 66%, 58% 24%, 35%, 32% 48%, 44%, 48%

      Comma separated values represent:

      • December 2021
      • June 2021
      • March 2021

      Now that the world’s younger children are beginning to be vaccinated, further changes in consumer behaviour are sure to surface in our next PwC Global Consumer Insights Survey. Certain habits formed during the pandemic will stick. But what nuances will emerge, what cohorts will be driving the most significant trends, and how will different parts of the world move forward? We’ll explore these questions and others in our next survey.


      Get in touch