


PwC and the World Energy Council have a common goal of promoting energy transition and sustainability by engaging with policymakers and leading industry players. As part of our Global Innovation Partnership we have developed a series of publications, in collaboration with EPRI, focussed on innovation.
"Hydrogen on the horizon. Ready, Almost set, Go?" gathers new critical insights on hydrogen state of play, opportunities and challenges worldwide to better understand the real potential of clean hydrogen in the energy transition. Explore the series here:
Quantifying the opportunity in green hydrogen
An analysis of the future economics of renewable energy identifies the most promising markets for importing and exporting
Green hydrogen—produced through renewable resources such as solar and wind—holds significant promise in meeting the world’s future energy demands. However, the economics of green hydrogen are challenging today, primarily because the underlying costs and availability of renewable energy sources vary widely. Recently, PwC analysed the green hydrogen market worldwide and identified potential demand growth, cost trajectories per country and the most promising export and import markets. The results give policymakers and industry leaders guidance on how the future market for green hydrogen could evolve.
Key findings:
- Demand growth will grow at a moderate, steady pace through niche applications until 2030.
- After 2030, demand growth will accelerate, particularly from 2035 onward.
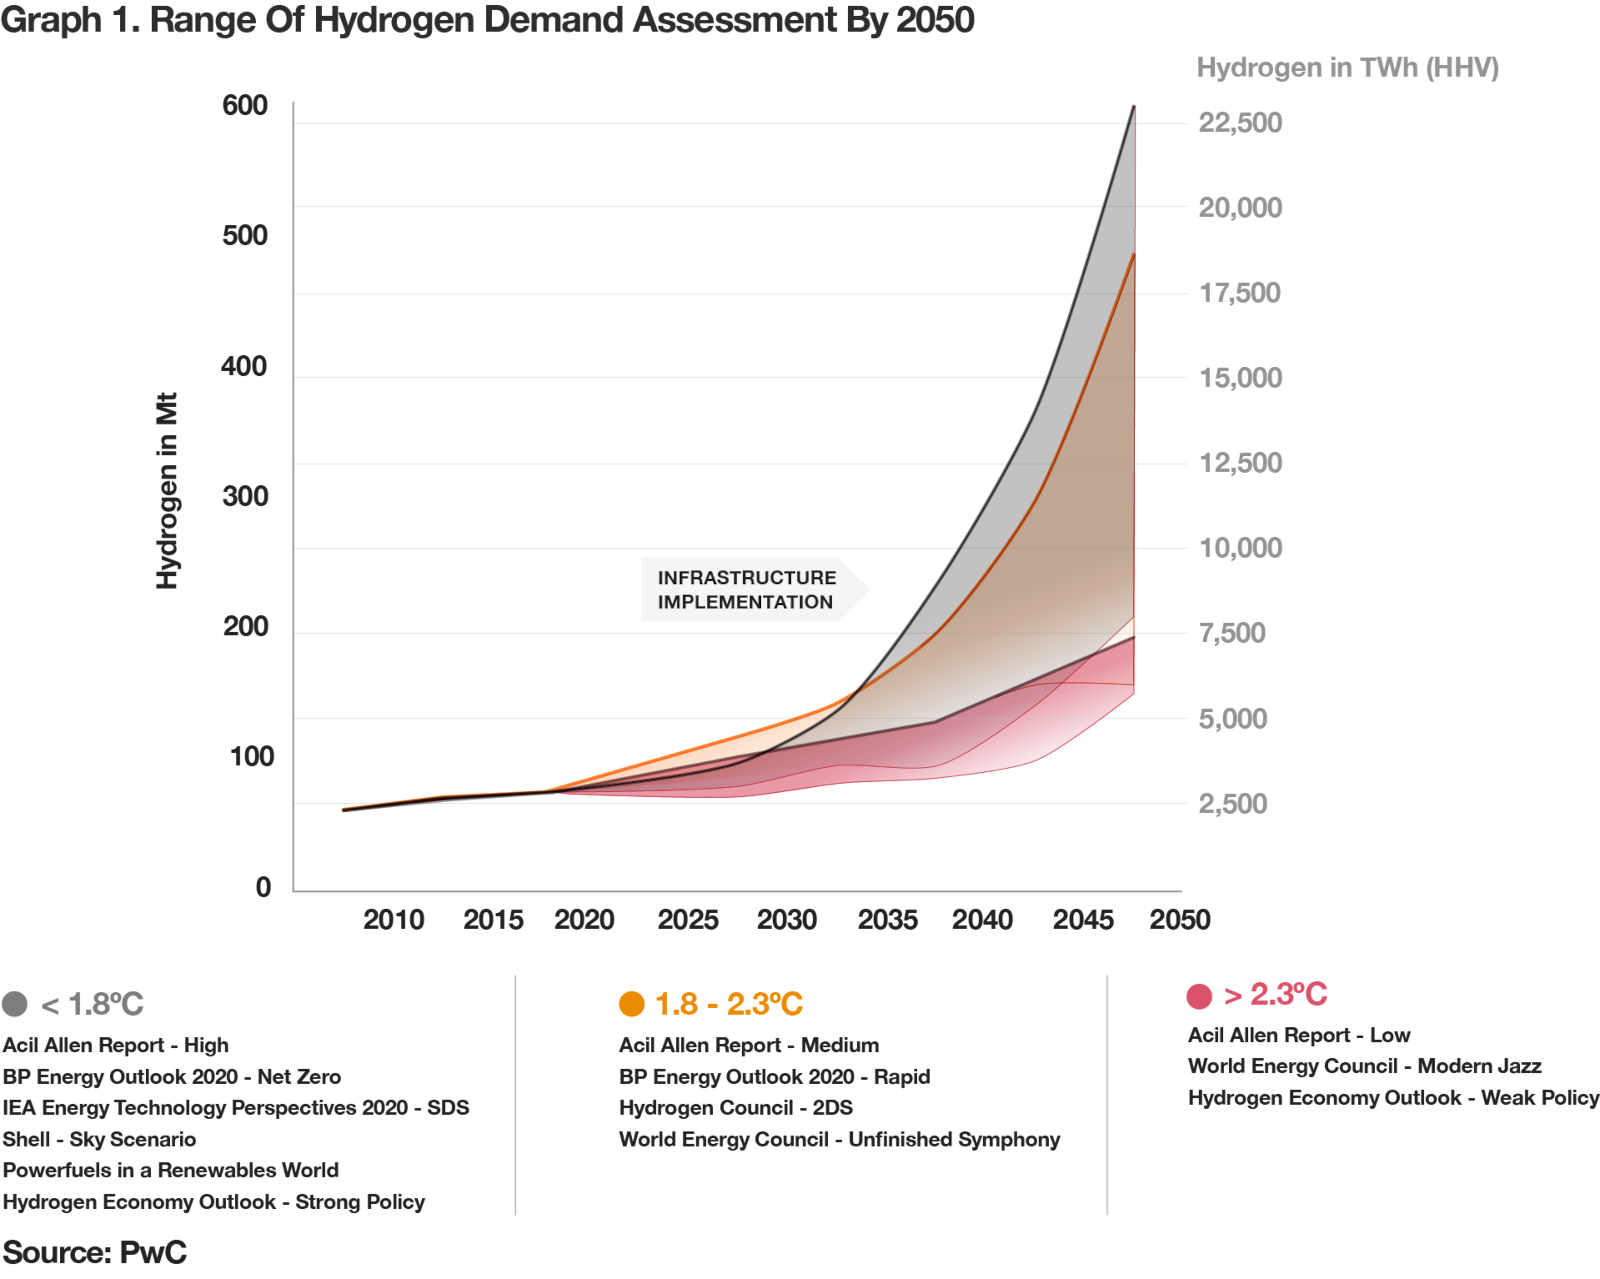
- Hydrogen demand by 2050 could vary from 150 to 500 million metric tonnes per year, depending on global climate ambitions and the development of sector-specific activities, energy-efficiency measures, direct electrification and the use of carbon-capture technologies.
The current situation
Right now, almost all hydrogen produced worldwide is “grey,” which means it is produced from natural gas. Without a price on carbon emissions, grey hydrogen is inexpensive (€1 to €2 per kilogram), but it compounds the challenge of improving environmental sustainability. Green hydrogen, in contrast, uses renewable electricity to power electrolysis that splits water molecules into hydrogen and oxygen. Because green hydrogen doesn’t require fossil fuels, it is a better long-term solution to help decarbonize economies. Yet green hydrogen—currently costing €3 to €8/kg in some regions—is more expensive than grey.
The most attractive production markets for green hydrogen are those with abundant, low-cost renewable resources. In parts of the Middle East, Africa, Russia, the US and Australia, for example, green hydrogen could be produced for €3 to €5/kg today. In Europe, production costs vary from €3 to €8/kg. The low end of these ranges can be achieved most easily in locations with access to low-cost renewable energies plants.
Yet production costs will decrease over time, due to continuously falling renewable energy production costs, economies of scale, lessons from projects underway and technological advances. As a result, green hydrogen will become more economical. The challenge is anticipating those trends and acting in time.

Hydrogen demand dynamics
H2 demand projections vary significantly due in part to different central assumptions in the modelling. Key differences include:
- development of economic activities,
- the global energy demand,
- development of renewable electricity pricing,
- use intensity within different sectors, and
- technology deployment, such as electrification or carbon capture and utilization/storage
- development of the regulatory framework.
Our report with the World Energy Council and EPRI analyses and compares the global H2 demand projections of 15 scenarios from 7 different reports, and sorts each scenario into one of three categories related to the ambition to reduce global temperature rise:
- Low: >2.3°C global warming,
- Medium: 1.8-2.3°C global warming, and
- High: <1.8°C global warming
After grouping the scenarios, the report analyses the average growth ranges of global hydrogen demand and calculated the standard deviation for each category.
- Long-term development of hydrogen demand
- Hydrogen demand is related to underlying temperature goals
- The use of hydrogen
Long-term development of hydrogen demand
All reports predict a limited but steady growth of hydrogen demand until 2030, for several reasons. First, current hydrogen projects under construction and in operation are, despite growing capacities, almost exclusively at pre-commercial phase and have limited electrolyser capacities, typically well below 50MW. Proposed plants have larger electrolyser capacites of 100MW or more, but those are still small compared to current grey hydrogen production plants. Second, building the infrastructure for large scale hydrogen use, such as pipelines or export/ import terminals, will take many years—it takes seven to twelve years to plan and build a pipeline, for example. Ideally, the required infrastructure will be built in parallel to growing hydrogen demand at falling costs to ensure that by 2030 hydrogen can be traded and transported in necessary quantities. All medium and high ambition scenarios see a stronger hydrogen demand from 2030 and another strong increase from 2035 onwards. To meet the Paris climate targets, planning for infrastructure has to begin now.
Hydrogen demand is related to underlying temperature goals
The standard deviation adjusted hydrogen demand in the various scenarios varies greatly for 2050, with an overall range from 150 to 600 Mt. Based on the temperature targets in the scenarios, larger quantities of hydrogen are needed to achieve more ambitious climate targets. Under the low ambition target of above 2.3°C, hydrogen demand growth will be linear as natural gas continues to be used. Hence, the hydrogen demand in 2050 varies ranges between 150 to 200 Mt.
Aiming to limit the global warming to 1.8-2.3°C by 2050 results in higher demand – between 160 to 490 Mt, with an average growth to around 320 Mt. The wide range of hydrogen demand is due to the different scenario assumptions about the technologies used, e.g. continued use of natural gas, efficiency improvements, direct electrification or CCS.
Striving to meet a Paris Agreement aligned global warming target of below 1.8°C results in a hydrogen demand of 220-600 Mt by 2050, with an average growth to around 350 Mt.
The use of hydrogen
The hydrogen demand breakdown per sectors can vary widely. For the European Union, the expected breakdown, as outlined in the European Hydrogen Roadmap, is 39% of hydrogen usage in the industry sector, 30 % in transport, 26 % in heating and power for buildings and 5 % power generation. For industrialized countries the EU breakdown is likely to be a good proxy to estimate the sector breakdowns.
Analysing the future market
PwC evaluated the production cost trajectory of green hydrogen worldwide, giving us a better understanding of early movers and potentially large suppliers across countries and regions.
The key results of our analysis include the following:
- Through 2030, hydrogen demand will grow at a moderate, steady pace through many niche applications across the industrial, transport, energy and buildings sectors.
- Through cross-sector collaborations, new alliances will form to develop hydrogen projects.
- Hydrogen production costs will decrease by around 50% through 2030, and then continue to fall steadily at a slightly slower rate until 2050.
- By 2050, green hydrogen production costs in some parts of the Middle East, Africa, Russia, China, the US and Australia will be in the range of €1 to €1.5/kg.
- Over the same time period, production costs in regions with limited renewable resources, such as large parts of Europe, Japan or Korea, will be approximately €2/kg, making these markets likely importers of green hydrogen from elsewhere.
- Even regions with good renewable resources but densely populated areas will import hydrogen, as land constraints limit the production of green electricity for direct use and conversion to hydrogen.
- Many large countries—such as the US, Canada, Russia, China, India and Australia—have regions for both competitive and non-competitive hydrogen production, which could prompt them to develop in-country trading.
- Export and import hubs will develop around the world, similar to current oil and gas hubs, but with new players in renewable-rich regions.
Discover the development of renewable hydrogen in our two data tools below
| Country | 2020 | 2030 | 2040 | 2050 |
|---|---|---|---|---|
| Afghanistan | 4.52 | 2.40 | 1.44 | 1.14 |
| Albania | 5.74 | 3.23 | 2.08 | 1.54 |
| Algeria | 4.37 | 2.33 | 1.40 | 1.11 |
| Andorra | 5.50 | 2.99 | 1.61 | 1.31 |
| Angola | 4.37 | 2.58 | 1.40 | 1.11 |
| Antigua and Barbuda | 4.75 | 2.76 | 1.49 | 1.19 |
| Argentina | 4.29 | 2.42 | 1.32 | 1.27 |
| Armenia | 5.49 | 2.99 | 1.85 | 1.54 |
| Australia | 4.67 | 2.60 | 1.41 | 1.12 |
| Austria | 6.58 | 3.63 | 2.29 | 1.96 |
| Azerbaijan | 5.66 | 3.07 | 1.89 | 1.58 |
| Bahrain | 4.69 | 2.48 | 1.24 | 1.18 |
| Bangladesh | 5.55 | 3.02 | 1.86 | 1.55 |
| Barbados | 4.76 | 2.77 | 1.50 | 1.20 |
| Belarus | 5.07 | 3.43 | 2.49 | 2.44 |
| Belgium | 4.08 | 2.71 | 2.14 | 2.10 |
| Belize | 5.10 | 2.93 | 1.58 | 1.27 |
| Benin | 4.96 | 2.86 | 1.54 | 1.24 |
| Bhutan | 5.22 | 2.86 | 1.78 | 1.48 |
| Bolivia | 4.55 | 2.43 | 1.55 | 1.27 |
| Bosnia and Herzegovina | 6.21 | 3.33 | 2.13 | 1.59 |
| Botswana | 4.39 | 2.59 | 1.40 | 1.11 |
| Brazil | 4.67 | 2.47 | 1.47 | 1.18 |
| Brunei | 5.51 | 3.00 | 1.61 | 1.54 |
| Bulgaria | 6.25 | 3.35 | 2.14 | 1.83 |
| Burkina Faso | 4.83 | 2.80 | 1.51 | 1.21 |
| Burundi | 5.19 | 2.84 | 1.54 | 1.23 |
| Cambodia | 5.42 | 2.95 | 1.59 | 1.52 |
| Cameroon | 5.08 | 2.79 | 1.51 | 1.21 |
| Canada | 3.91 | 2.62 | 1.87 | 1.36 |
| Cape Verde | 4.83 | 2.80 | 1.51 | 1.21 |
| Central African Republic | 5.01 | 2.76 | 1.49 | 1.19 |
| Chad | 4.21 | 2.26 | 1.13 | 1.07 |
| Chile | 3.68 | 2.13 | 1.06 | 1.01 |
| China | 4.15 | 2.23 | 1.35 | 1.06 |
| Colombia | 4.94 | 2.85 | 1.77 | 1.47 |
| Comoros | 4.93 | 2.60 | 1.54 | 1.24 |
| Congo, Democratic Republic of the | 5.01 | 2.76 | 1.49 | 1.19 |
| Congo, Republic of the | 5.52 | 3.00 | 1.62 | 1.31 |
| Costa Rica | 4.92 | 2.84 | 1.53 | 1.23 |
| Cote d'Ivoire | 4.97 | 2.86 | 1.54 | 1.24 |
| Croatia | 6.18 | 3.32 | 2.13 | 1.58 |
| Cuba | 4.76 | 2.77 | 1.50 | 1.20 |
| Cyprus | 5.04 | 3.03 | 1.97 | 1.67 |
| Czech Republic | 5.39 | 3.58 | 2.57 | 2.52 |
| Denmark | 3.65 | 2.37 | 1.63 | 1.59 |
| Djibouti | 4.60 | 2.44 | 1.46 | 1.16 |
| Dominica | 5.18 | 2.96 | 1.60 | 1.29 |
| Dominican Republic | 4.63 | 2.70 | 1.46 | 1.17 |
| East Timor (Timor-Leste) | 5.09 | 2.80 | 1.51 | 1.45 |
| Ecuador | 5.23 | 2.86 | 1.78 | 1.24 |
| Egypt | 4.25 | 2.28 | 1.37 | 1.08 |
| El Salvador | 4.66 | 2.72 | 1.47 | 1.17 |
| Equatorial Guinea | 5.75 | 3.11 | 1.67 | 1.36 |
| Eritrea | 4.48 | 2.38 | 1.43 | 1.13 |
| Estonia | 4.63 | 3.09 | 2.21 | 2.17 |
| Ethiopia | 4.42 | 2.35 | 1.41 | 1.12 |
| Fiji | 5.56 | 3.02 | 1.63 | 1.55 |
| Finland | 6.33 | 4.28 | 3.15 | 2.85 |
| France | 4.48 | 3.02 | 2.18 | 1.90 |
| Gabon | 5.66 | 3.07 | 1.65 | 1.34 |
| Georgia | 5.73 | 3.10 | 1.91 | 1.59 |
| Germany | 4.91 | 3.22 | 2.28 | 2.23 |
| Ghana | 5.04 | 2.90 | 1.56 | 1.26 |
| Greece | 5.18 | 3.09 | 2.01 | 1.70 |
| Grenada | 4.72 | 2.75 | 1.48 | 1.19 |
| Guatemala | 4.65 | 2.71 | 1.47 | 1.17 |
| Guinea | 4.75 | 2.76 | 1.49 | 1.19 |
| Guinea-Bissau | 4.94 | 2.85 | 1.54 | 1.24 |
| Guyana | 5.09 | 2.80 | 1.75 | 1.45 |
| Haiti | 4.60 | 2.69 | 1.46 | 1.16 |
| Honduras | 4.66 | 2.72 | 1.47 | 1.17 |
| Hungary | 6.89 | 3.90 | 2.30 | 2.21 |
| Iceland | 2.51 | 1.93 | 1.44 | 1.34 |
| India | 4.39 | 2.59 | 1.64 | 1.11 |
| Indonesia | 5.09 | 2.80 | 1.51 | 1.45 |
| Iran | 4.46 | 2.62 | 1.42 | 1.13 |
| Iraq | 4.54 | 2.66 | 1.44 | 1.15 |
| Ireland | 3.24 | 2.18 | 1.53 | 1.50 |
| Israel | 4.39 | 2.59 | 1.40 | 1.11 |
| Italy | 5.74 | 2.98 | 1.84 | 1.77 |
| Jamaica | 4.76 | 2.77 | 1.50 | 1.20 |
| Japan | 6.39 | 3.82 | 2.75 | 2.50 |
| Jordan | 4.31 | 2.55 | 1.39 | 1.10 |
| Kazakhstan | 5.54 | 3.01 | 1.86 | 1.55 |
| Kenya | 4.48 | 2.38 | 1.43 | 1.13 |
| Kiribati | 4.79 | 2.66 | 1.44 | 1.38 |
| Korea, North | 6.44 | 3.82 | 2.75 | 2.50 |
| Korea, South | 6.44 | 3.82 | 2.75 | 2.50 |
| Kosovo | 6.31 | 3.50 | 2.22 | 1.67 |
| Kuwait | 4.79 | 2.53 | 1.27 | 1.20 |
| Kyrgyzstan | 4.85 | 2.56 | 1.52 | 1.22 |
| Laos | 5.70 | 3.08 | 1.66 | 1.59 |
| Latvia | 4.72 | 3.13 | 2.24 | 2.19 |
| Lebanon | 4.55 | 2.66 | 1.44 | 1.15 |
| Lesotho | 4.46 | 2.62 | 1.42 | 1.13 |
| Liberia | 5.75 | 3.24 | 1.85 | 1.54 |
| Libya | 4.17 | 2.24 | 1.35 | 1.06 |
| Liechtenstein | 6.80 | 3.73 | 2.34 | 2.01 |
| Lithuania | 5.73 | 3.61 | 2.48 | 2.42 |
| Luxembourg | 4.08 | 2.71 | 2.14 | 2.10 |
| Macedonia | 5.99 | 3.35 | 2.14 | 1.59 |
| Madagascar | 4.48 | 2.63 | 1.43 | 1.13 |
| Malawi | 4.66 | 2.72 | 1.47 | 1.17 |
| Malaysia | 5.46 | 2.97 | 1.60 | 1.53 |
| Maldives | 5.52 | 2.88 | 1.79 | 1.49 |
| Mali | 4.61 | 2.44 | 1.46 | 1.16 |
| Malta | 5.52 | 2.88 | 1.79 | 1.72 |
| Marshall Islands | 5.05 | 2.78 | 1.50 | 1.44 |
| Mauritania | 4.53 | 2.65 | 1.44 | 1.14 |
| Mauritius | 4.80 | 2.53 | 1.51 | 1.21 |
| Mexico | 4.35 | 2.32 | 1.39 | 1.10 |
| Micronesia, Federated States of | 5.51 | 3.00 | 1.62 | 1.54 |
| Moldova | 6.75 | 3.84 | 2.26 | 1.94 |
| Monaco | 5.68 | 3.07 | 1.89 | 1.82 |
| Mongolia | 4.74 | 2.50 | 1.49 | 1.19 |
| Montenegro | 6.27 | 3.36 | 2.15 | 1.60 |
| Morocco | 4.34 | 2.57 | 1.39 | 1.10 |
| Mozambique | 4.83 | 2.80 | 1.51 | 1.21 |
| Myanmar (Burma) | 5.29 | 2.89 | 1.56 | 1.49 |
| Namibia | 4.24 | 2.52 | 1.37 | 1.08 |
| Nauru | 5.10 | 2.80 | 1.52 | 1.45 |
| Nepal | 4.21 | 2.01 | 1.13 | 1.07 |
| Netherlands | 3.81 | 2.58 | 1.84 | 1.81 |
| New Zealand | 3.71 | 2.40 | 1.64 | 1.61 |
| Nicaragua | 4.68 | 2.73 | 1.48 | 1.18 |
| Niger | 4.40 | 2.34 | 1.17 | 1.11 |
| Nigeria | 5.03 | 2.57 | 1.50 | 1.20 |
| Norway | 3.53 | 2.33 | 1.82 | 1.57 |
| Oman | 4.25 | 2.28 | 1.13 | 1.08 |
| Pakistan | 4.30 | 2.55 | 1.62 | 1.09 |
| Palau | 5.61 | 3.04 | 1.64 | 1.57 |
| Panama | 5.00 | 2.88 | 1.55 | 1.25 |
| Papua New Guinea | 5.20 | 2.85 | 1.54 | 1.47 |
| Paraguay | 5.45 | 2.97 | 1.83 | 1.53 |
| Peru | 4.27 | 2.03 | 1.37 | 1.09 |
| Philippines | 5.23 | 2.86 | 1.55 | 1.48 |
| Poland | 5.02 | 3.27 | 2.31 | 2.26 |
| Portugal | 4.91 | 2.83 | 1.53 | 1.23 |
| Qatar | 4.68 | 2.48 | 1.24 | 1.18 |
| Romania | 6.54 | 3.74 | 2.21 | 1.89 |
| Russia | 3.83 | 2.46 | 1.67 | 1.40 |
| Rwanda | 5.35 | 2.92 | 1.58 | 1.27 |
| Saint Kitts and Nevis | 4.76 | 2.76 | 1.49 | 1.20 |
| Saint Lucia | 4.77 | 2.77 | 1.50 | 1.20 |
| Saint Vincent and the Grenadines | 4.77 | 2.77 | 1.50 | 1.20 |
| Samoa | 5.38 | 2.94 | 1.58 | 1.51 |
| San Marino | 6.29 | 3.24 | 1.98 | 1.90 |
| Sao Tome and Principe | 5.38 | 3.06 | 1.65 | 1.34 |
| Saudi Arabia | 4.26 | 2.28 | 1.14 | 1.08 |
| Senegal | 4.76 | 2.76 | 1.49 | 1.20 |
| Serbia | 6.71 | 3.82 | 2.25 | 1.93 |
| Seychelles | 5.15 | 2.70 | 1.59 | 1.29 |
| Sierra Leone | 5.58 | 3.16 | 1.80 | 1.50 |
| Singapore | 6.00 | 3.23 | 1.74 | 1.65 |
| Slovakia | 6.96 | 3.94 | 2.32 | 1.99 |
| Slovenia | 6.58 | 3.51 | 2.22 | 1.67 |
| Solomon Islands | 5.53 | 3.00 | 1.62 | 1.55 |
| Somalia | 4.42 | 2.32 | 1.41 | 1.12 |
| South Africa | 4.30 | 2.55 | 1.38 | 1.09 |
| South Sudan | 4.76 | 2.52 | 1.50 | 1.20 |
| Spain | 4.88 | 2.70 | 1.46 | 1.16 |
| Sri Lanka | 5.43 | 2.84 | 1.77 | 1.47 |
| Sudan | 4.32 | 2.31 | 1.39 | 1.10 |
| Suriname | 5.09 | 2.80 | 1.75 | 1.45 |
| Swaziland | 5.00 | 2.88 | 1.55 | 1.25 |
| Sweden | 5.36 | 3.82 | 2.91 | 2.63 |
| Switzerland | 3.53 | 2.33 | 1.82 | 1.57 |
| Syria | 4.48 | 2.63 | 1.43 | 1.13 |
| Taiwan | 6.35 | 3.78 | 2.10 | 1.56 |
| Tajikistan | 4.49 | 2.39 | 1.43 | 1.14 |
| Tanzania | 4.48 | 2.38 | 1.43 | 1.13 |
| Thailand | 5.43 | 2.96 | 1.60 | 1.52 |
| The Bahamas | 4.89 | 2.82 | 1.53 | 1.23 |
| The Gambia | 4.85 | 2.81 | 1.52 | 1.22 |
| Togo | 5.04 | 2.90 | 1.56 | 1.26 |
| Tonga | 5.53 | 3.00 | 1.62 | 1.55 |
| Trinidad and Tobago | 4.94 | 2.85 | 1.54 | 1.24 |
| Tunisia | 5.11 | 2.94 | 1.92 | 1.39 |
| Turkey | 4.72 | 2.49 | 1.72 | 1.42 |
| Turkmenistan | 4.92 | 2.84 | 1.77 | 1.47 |
| Tuvalu | 5.46 | 2.97 | 1.60 | 1.53 |
| Uganda | 4.89 | 2.70 | 1.46 | 1.17 |
| Ukraine | 6.75 | 3.59 | 2.26 | 1.94 |
| United Arab Emirates | 4.61 | 2.44 | 1.22 | 1.16 |
| United Kingdom | 3.81 | 2.58 | 1.84 | 1.81 |
| United States of America | 4.35 | 2.57 | 1.63 | 1.10 |
| Uruguay | 5.61 | 2.92 | 1.81 | 1.51 |
| Uzbekistan | 4.91 | 2.83 | 1.77 | 1.46 |
| Vanuatu | 5.57 | 3.02 | 1.63 | 1.56 |
| Vatican City (Holy See) | 5.85 | 3.03 | 1.87 | 1.80 |
| Venezuela | 4.93 | 2.73 | 1.71 | 1.41 |
| Vietnam | 5.45 | 2.85 | 1.77 | 1.47 |
| Yemen | 4.22 | 2.26 | 1.13 | 1.07 |
| Zambia | 4.65 | 2.71 | 1.47 | 1.17 |
| Zimbabwe | 4.60 | 2.69 | 1.46 | 1.16 |
| Country | Final indication |
|---|---|
| Morocco | 1.0 |
| Namibia | 1.6 |
| South Africa | 2.0 |
| China | 3.1 |
| India | 3.1 |
| Japan | 4.7 |
| Qatar | 1.4 |
| Russia | 1.6 |
| Saudi Arabia | 1.1 |
| Korea, South | 4.1 |
| Turkey | 3.1 |
| United Arab Emirates | 1.5 |
| Austria | 4.3 |
| Belgium | 4.9 |
| Finland | 3.7 |
| France | 4.4 |
| Germany | 4.7 |
| Greece | 3.4 |
| Italy | 4.1 |
| Luxembourg | 4.3 |
| Netherlands | 4.4 |
| Norway | 2.3 |
| Poland | 4.0 |
| Portugal | 3.0 |
| Spain | 2.0 |
| Sweden | 3.3 |
| Switzerland | 4.3 |
| United Kingdom | 4.0 |
| Canada | 1.5 |
| United States of America | 3.1 |
| Australia | 1.0 |
| Chile | 1.7 |
| Argentina | 2.0 |
| Brazil | 3.0 |
| Iceland | 1.0 |
Identifying likely exporters and importers
In addition to the economic analysis, we considered national hydrogen strategies, projects that have already been announced, and market trends, thus enabling us to estimate future trade flows. The results are shown in the world map, indicating whether a country is likely to be an exporter, an importer, or self-sufficient.
The results show that countries with large swaths of undeveloped land and abundant renewable energy are developing strategies to produce green hydrogen and export any excess. In contrast, countries with insufficient unused land, dense populations and limited renewable resources are more likely to favour imported green hydrogen. These results match public letters of intent for the sale of renewable hydrogen—for example, from Morocco to Germany or from Australia to Japan.

The need to take action today
Countries need to start implementing pilot projects as soon as possible, to gain practical experience and capitalise on efficiencies through learning curves and scale effects on production equipment, such as electrolysers. Developing projects today is important to ensure continuous demand growth, which justifies the implementation of the required hydrogen infrastructure to meet future greenhouse gas reduction targets. In addition, the regulatory framework—including subsidies, taxes and levies—has a huge impact on CapEx and OpEx, which can dramatically swing the economics of projects. It is essential that governments around the world pursue hydrogen-supportive policies and create a regulatory framework that encourages investment in production equipment.
Priorities for management teams
Make sure you have the below priorities in place to be prepared for the near future:
- develop a company-specific hydrogen strategy, including technological requirements, M&A activities and partnerships, and the specific requirements of emerging markets.
- identify pilot projects, analyse their technical and economic feasibility, and evaluate financing possibilities.
- optimise the business case through measures such as identifying suitable funding initiatives and the use of by-products.
- assess legal and regulatory implications on a national and international level.
- identify suitable R&D as well as project subsidies worldwide.
- develop and implement hydrogen procurement and trade strategies.
- understand national and international certification models for green hydrogen and its derivates.
- integrating hydrogen-related projects into reporting.


Follow us


Contact us

Global Energy, Utilities and Resources Leader, Partner, PwC Netherlands
Tel: +31-88-7921328


Global Energy, Utilities and Resources Industry Executive, PwC Germany
Tel: +49 211 981 4602


Partner, Global Sustainability Leader, PwC United Kingdom
Tel: +44 (0)7710 157908


Global Private Equity, Real Assets and Sovereign Funds Leader, PwC United States
Tel: +1 617-834-4900